

Radar image-based flyer target identifying and tracking method
A target recognition and radar image technology, applied in the field of image processing, can solve the problems of bird target recognition and tracking without systematic mature methods and practices, and achieve the effect of reducing false alarm rate, broad application prospects, and meeting real-time requirements.
- Summary
- Abstract
- Description
- Claims
- Application Information
AI Technical Summary
Problems solved by technology
Method used
Image

Examples
Embodiment Construction
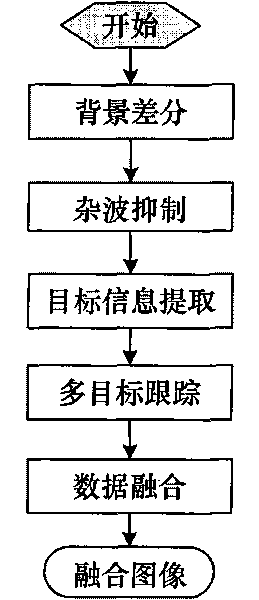
[0029] The radar image-based bird target recognition and tracking method provided by the present invention will be described in detail below with reference to the drawings and embodiments.
[0030] The bird target recognition and tracking method provided by the present invention is realized through the following steps:
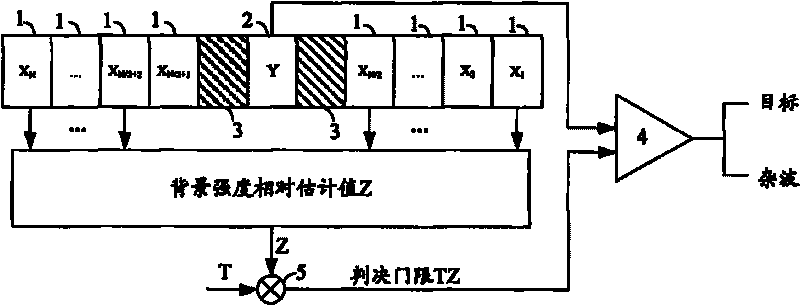
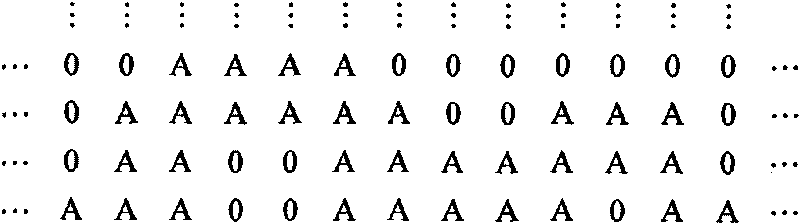
[0031] Step 1: Background difference.
[0032] The background difference refers to subtracting the background image from the PPI image of the bird detection radar, and the background image is constructed by the mean value method or the principal component analysis method.
[0033] The average method is the most commonly used and simplest background construction method. This method is usually suitable for situations where the target stays in the scene for a short time and the target does not appear frequently. The background is reconstructed for each frame of image. The calculation formula is as follows:
[0034] B k =...
PUM
 Abstract
Description
Claims
Application Information