
System for detecting blood flow parameters based on pulse wave measurement and analysis

A technology of parameter detection and pulse wave, which is applied in the field of blood flow parameter detection system, can solve the problems that the characteristics of pulse wave cannot be quantified, the peak 4 of dicrotic wave is blurred and disappears, etc.

Inactive Publication Date: 2010-08-04
深圳泰因特医疗系统有限公司
View PDF0 Cites 13 Cited by
  • Summary
  • Abstract
  • Description
  • Claims
  • Application Information

AI Technical Summary

Problems solved by technology

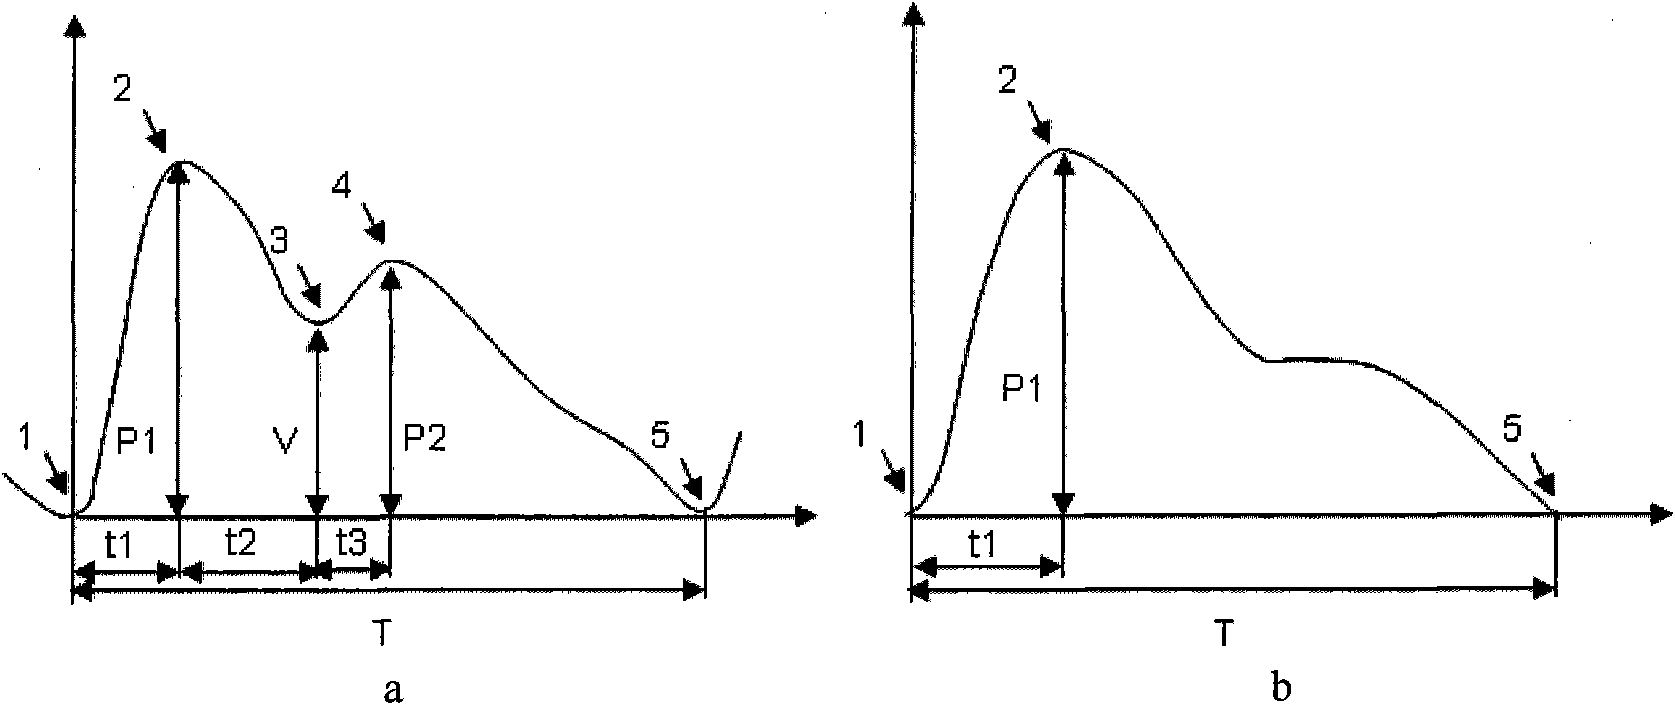
That is, the shape of the pulse wave often changes due to individual differences and different states, and a considerable part of the pulse wave signal does not have a dicrotic wave, which will cause figure 1 The trough 3 between the main wave and the dicrotic wave and the peak 4 of the dicrotic wave shown in a are blurred or even disappear, making it impossible to measure V, P2, t2, t3 and other indicators, making the characteristics of this part of the pulse wave impossible to quantify

Method used


Image

  • System for detecting blood flow parameters based on pulse wave measurement and analysis
  • System for detecting blood flow parameters based on pulse wave measurement and analysis
  • System for detecting blood flow parameters based on pulse wave measurement and analysis

Examples


Embodiment 1

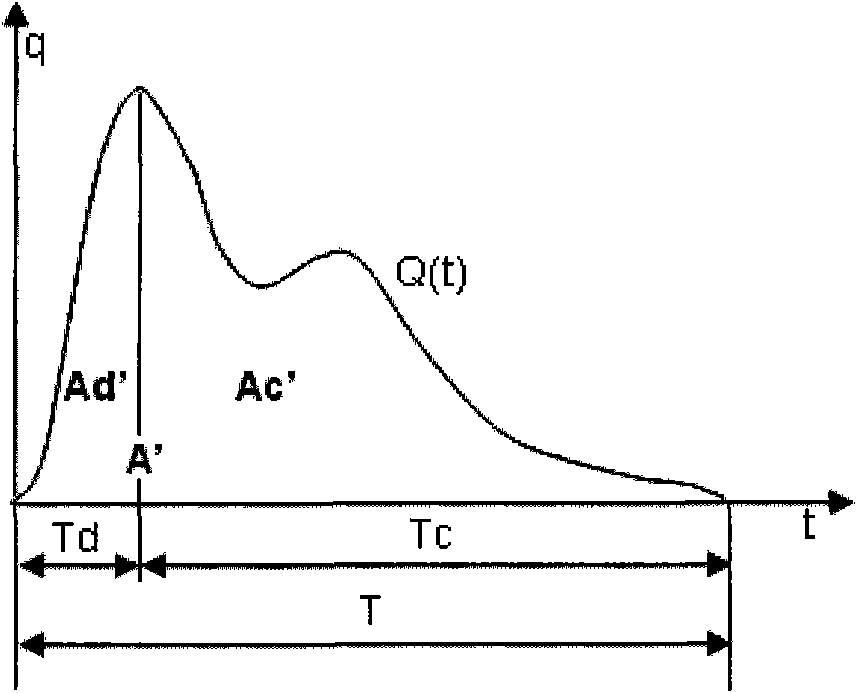
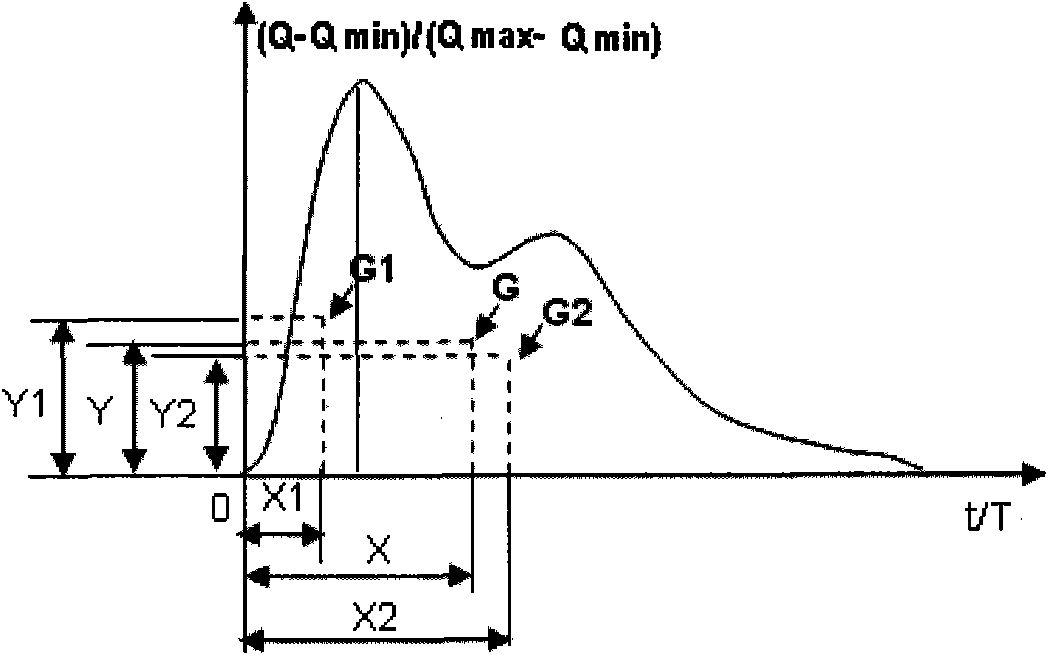
[0073] Such as Figure 9 As shown, in this example, the blood flow parameter detection system includes: a data acquisition module, which is used to collect pulse wave signals. Conversion and other processing; the data analysis module is used to analyze the pulse wave digital signal from the data acquisition module, quantify the pulse wave waveform characteristics into characteristic indicators, and the system also uses the characteristic indicators as calculation factors to perform further calculations to generate a series of quantified hemodynamics academic indicators. Perform time domain and frequency domain analysis on the above indicators to generate parameter lists and statistical charts.

[0074] These characteristic indicators include:

[0075] 1) The overall and local area under the pulse wave curve and its area coefficient, including the entire pulse wave area A', the wave area Ad' of the corresponding part of the ascending branch and its area coefficient Cd, and th...

Embodiment 2

[0084] Embodiment 2 clinical application

[0085]Apply the system of the present invention to collect data through fingertips and analyze them. Table 1 shows a total of 2000 samples of general healthy people in six different age groups randomly selected, the age span ranges from 18 to 82 years old, the fingertip volume blood flow pulse wave signal of each individual is collected in a quiet state, and the system of the present invention is used The obtained pulse wave characteristic indexes are calculated and counted, and the results are as follows:

[0086] Table 1 Analysis of pulse wave morphological characteristics of general healthy people in different age groups

[0087]

generation

average age

Number of samples

(X2-X) / (X-X1)

Mean age characteristic index

standard deviation

18 to 30 years old

24.10

380

0.345

0.061

31-40 years old

34.00

310

0.385

0.055

...


PUM


Abstract

The invention provides a system for detecting blood flow parameters based on pulse wave measurement and analysis. The system comprises a data acquisition module and a data analysis module, wherein the data acquisition module is used for acquiring pulse wave signals; and the data analysis module is used for processing the pulse wave signals obtained through acquisition, quantizing the wave characters of pulse waves into character indexes, carrying out time domain analysis and frequency domain analysis on the indexes, and generating a parameter list and a statistic chart. The working condition, the change process, the dynamic trend and the like of the cardiovascular blood flow can be non-invasively and continuously observed in real time through statically measuring and dynamically tracking the change of the character indexes. The invention can be used for the fitness test, the motion monitoring, the training assessment, the physique research, the disease screening, the health classification, the health management and the like of sports professional persons and common people.

Description

technical field [0001] The invention relates to the technical field of non-invasive detection and analysis of pulse waves, in particular to a blood flow parameter detection system with the functions of non-invasive collection, quantification and analysis of pulse waves. Background technique [0002] At present, the existing quantitative analysis method for pulse wave utilizes the following characteristic points of pulse wave, see figure 1 a, The troughs 1 and 5 of the pulse wave in the figure, the peak 2 of the main wave, the trough 3 between the main wave and the dicrotic wave, and the peak 4 of the dicrotic wave; P1: the peak height of the main pulse wave, P2: the dicrotic pulse wave Wave crest height, V: height of trough between main wave and dicrotic wave, T: pulsation period. The pulse wave can be quantified through the coordinates of the above-mentioned feature points. However, often due to individual differences, status or age differences, the pulse wave signals of ...

Claims


Application Information

Patent Timeline
Patent Type & Authority Applications(China)
IPC IPC(8): A61B5/02
Inventor 罗晓民
Owner 深圳泰因特医疗系统有限公司
Learn More