Method for visually testing resolution of each imaging area of digital camera

A technology of imaging area, digital camera, applied in the field of image processing

Inactive Publication Date: 2010-09-22
ZHEJIANG UNIV
View PDF0 Cites 14 Cited by
  • Summary
  • Abstract
  • Description
  • Claims
  • Application Information

AI Technical Summary

Problems solved by technology

[0010] In shooting, especially in remakes, there is often such a problem, that is, "should I take a photo directly or cut out the middle part of the photo and enlarge it to the size of the original photo to make it clear?"

Method used


Image

  • Method for visually testing resolution of each imaging area of digital camera
  • Method for visually testing resolution of each imaging area of digital camera
  • Method for visually testing resolution of each imaging area of digital camera

Examples


Embodiment 1

[0073] Example 1 Canon EF 28-135 image quality test at F8.0 at 135mm

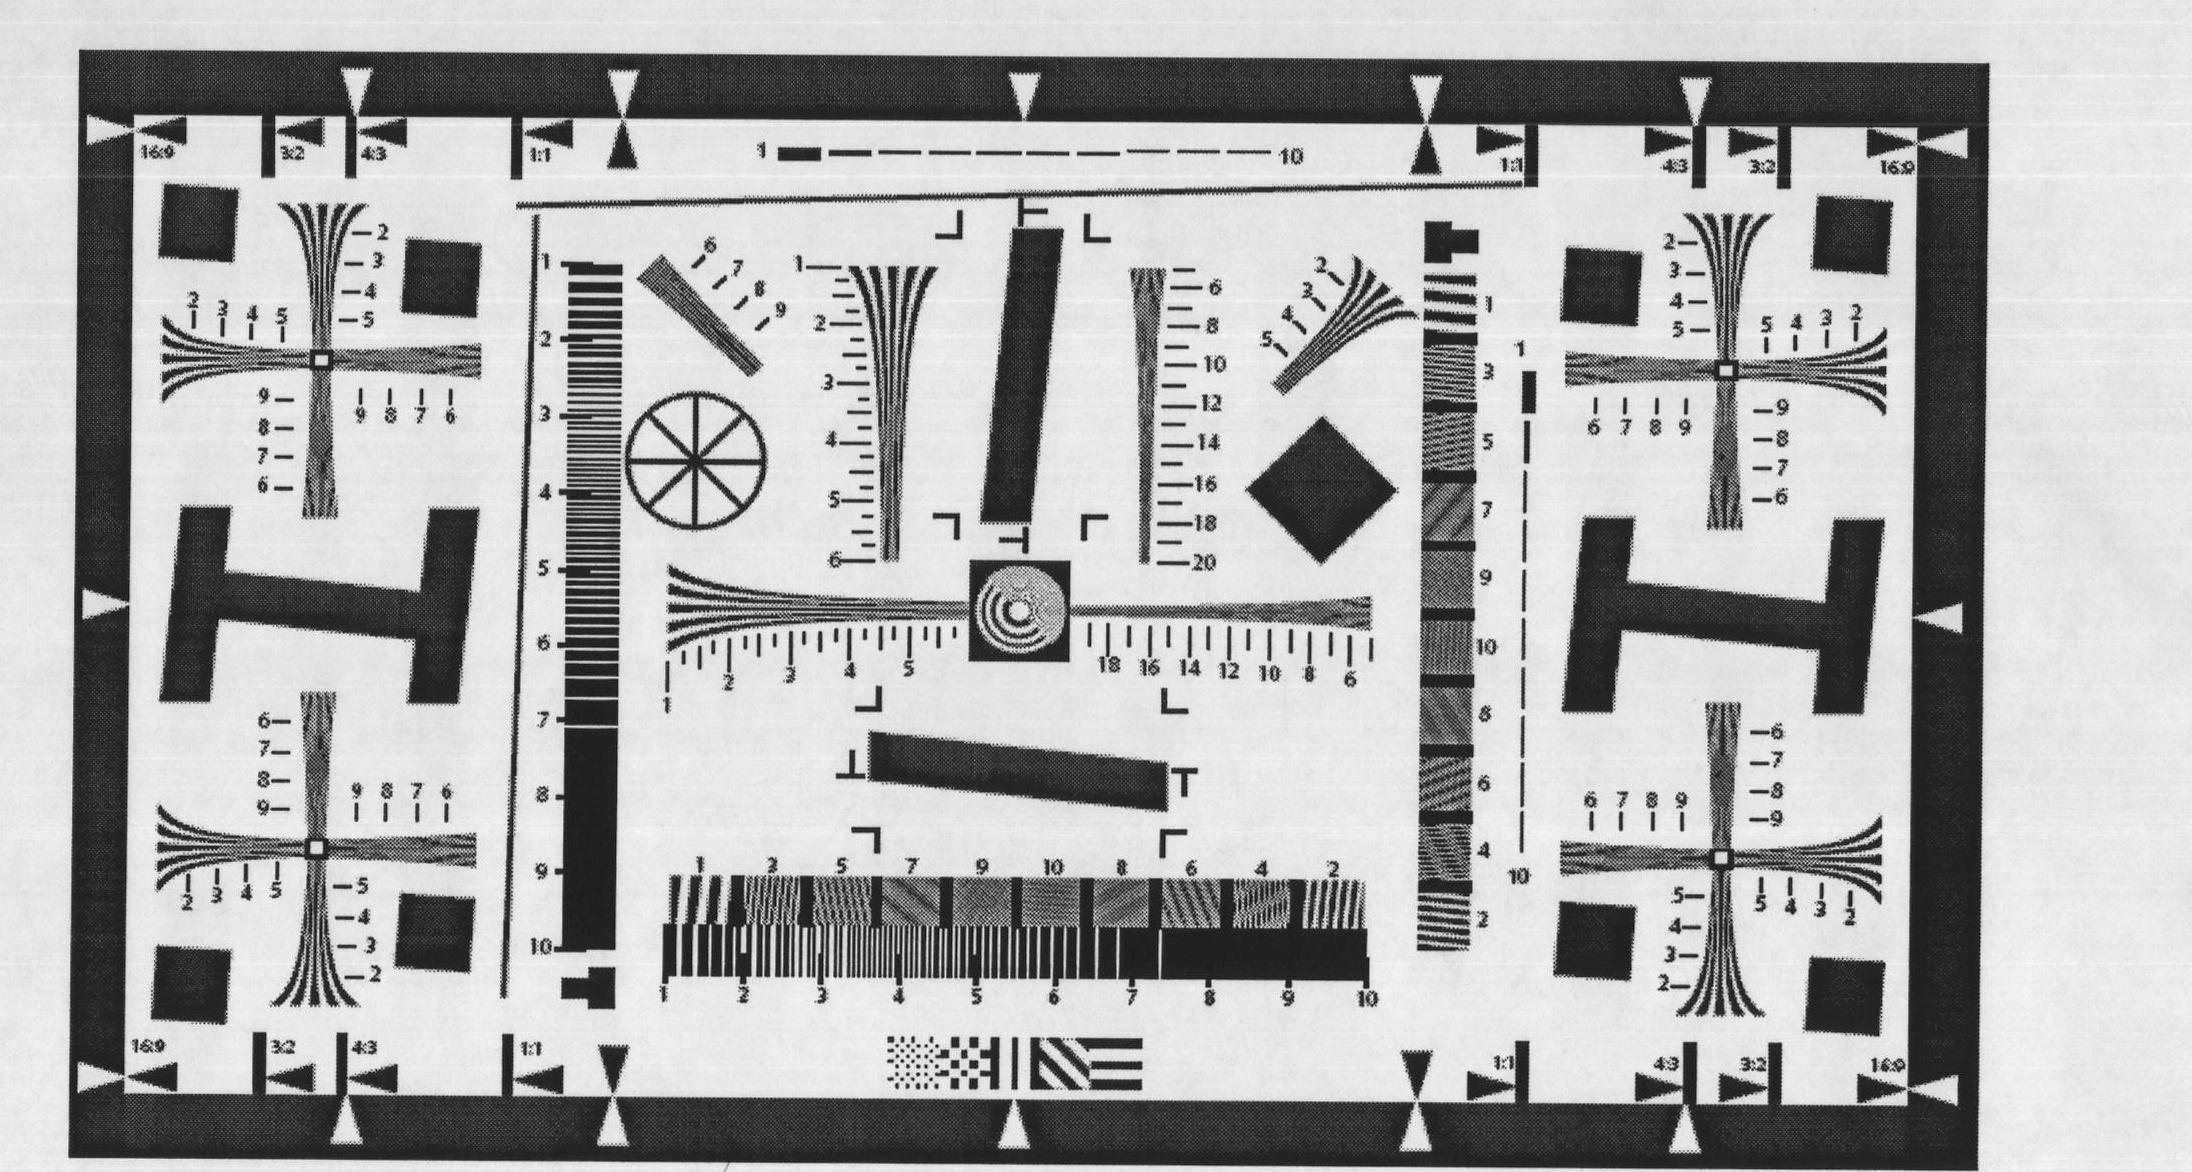
[0074] First prepare the resolution test board. The test board ( image 3 ) directly displayed on a monitor or a projector, or printed out and pasted on a glass or plastic plate. image 3 Each white dot in is a pixel, and the interval between white dots is 5 pixels (of course, the interval can also be larger or smaller). Then if it is displayed on a 30-inch monitor (DELL 3008WFP), there are a total of 2560×1600 pixels and about 512×320 white points. The use of monitors is mainly considered from the perspective of cost and convenience, because there are already high-resolution monitors. In fact, if you print a 30-inch screen, the cost is relatively high, and the mounting is also troublesome. Glass or plastic boards also cost money. If a high-resolution monitor is not readily available, it can also be printed and shot for testing.

[0075]The second is to shoot. Use a tripod to set up the camera Canon 1Ds...

Embodiment 2

[0098] Example 2 Canon EF 100-400L imaging quality test at F8.0 at 135mm

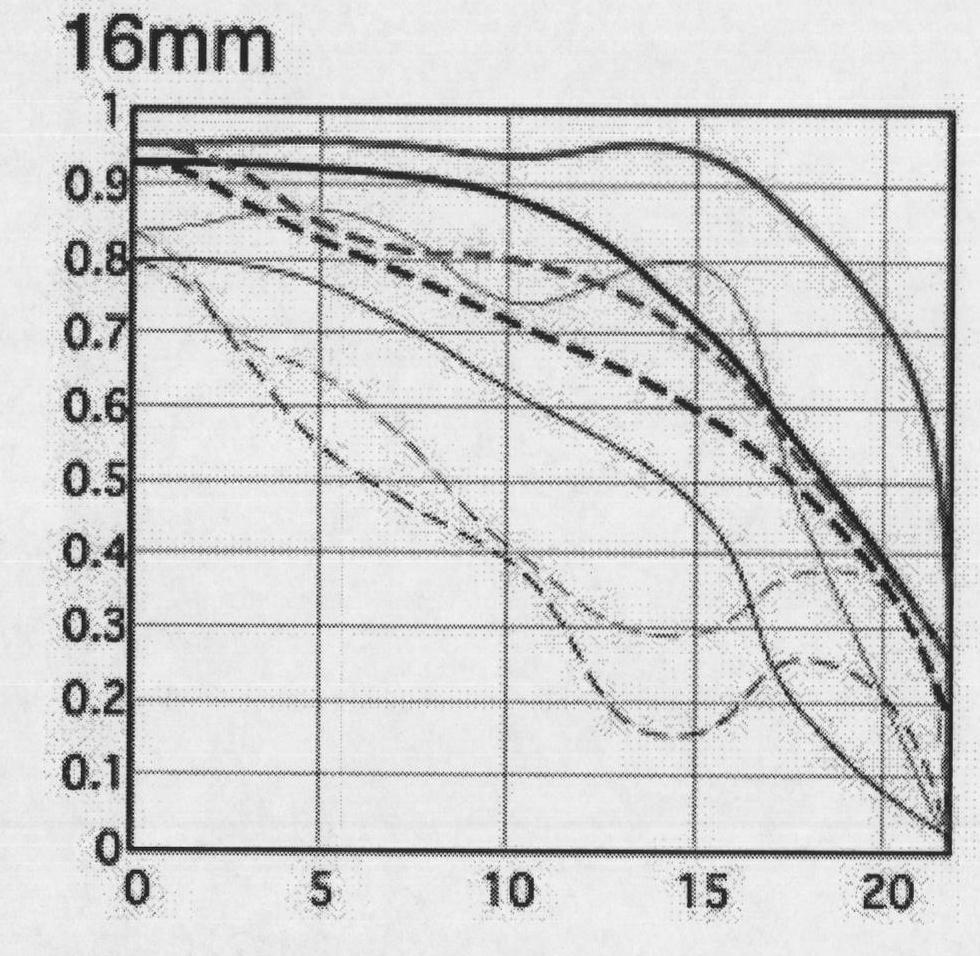
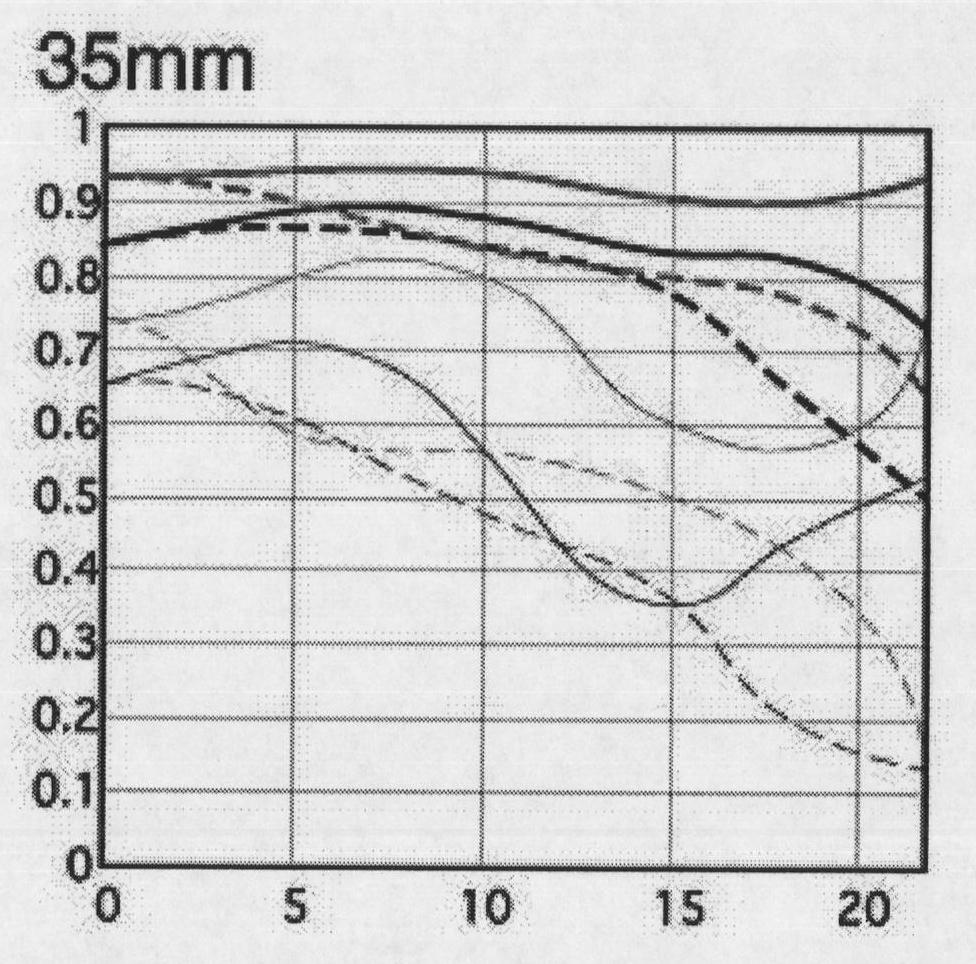
[0099] The test method and test panel of Example 1 were used. Figure 8a and Figure 8b The results of the edge and the center are given respectively. Although there is a certain amount of astigmatism and dispersion, it is not obvious. You can compare it with Figure 5.

[0100] Also use the method of Example 1 to measure astigmatism and resolution, relative astigmatism and resolution as an auxiliary reference.

[0101] Figure 9 and Figure 10 The results of astigmatism and resolution measurements are given, showing absolute and relative values, respectively. Absolute astigmatism increases substantially monotonically with increasing distance from the center. Since the relative astigmatism has to be divided by the distance, the final result depends on which one grows faster. from Figure 9 Look, there is no difference at all in the first line, and the difference can be barely seen after the second...


PUM


Abstract

The invention provides a method for visually testing the resolution of each imaging area of a digital camera, which comprises the following steps of: converting a photo into a gray level image; calculating the diameter of the image of the photo; performing vignetting glossiness loss correction; performing binaryzation on the image; marking a plurality of pixel blocks as foreground pixel blocks; removing the foreground pixel blocks from the corners of the photo or the foreground pixel blocks with small areas; by taking the centre of the image of the photo as the centre of a circle, establishing a plurality of concentric circles to divide the image of the photo into a plurality of circular areas and representing image divergence degrees in each circular area by using rectangular images; and according to neighboring relations of the circular areas, sequentially splicing all the obtained rectangular images into a test result graph. The method not only can determine a clear and available area of the photo shot by a set of shooting equipment, but also can compare the resolution of the fully-shot photo with that of middle screenshots of different ratios to find a shooting method through which maximum resolution can be realized, thereby ensuring that the definition in copying can be maximal or the number of the shot photos is the smallest on the premise of ensuring the definition.

Description

technical field [0001] The invention relates to the technical field of image processing, in particular to a method for testing astigmatism and resolution (resolution) of a digital camera. It can be used for resolution evaluation of ordinary digital cameras, digital SLR cameras and digital backs. Background technique [0002] The two most important performance indicators of digital camera quality are resolution and color. The resolution, sometimes called resolution, mainly refers to the evaluation of the resolution of detail capture. For color, if there is a color cast, it can also be rescued by color correction technology. But for the resolution, it is absolutely impossible to improve it through post-correction (image processing algorithm). The details that have not been captured in the photo will not be revealed no matter how interpolated, enlarged or sharpened. For example, if a 6-megapixel photo has a resolution of 1500, then interpolating it to 24 million pixels will ...

Claims


Application Information

Patent Timeline
Patent Type & Authority Applications(China)
IPC IPC(8): G06T7/00
Inventor 石洗凡刁常宇鲁东明
Owner ZHEJIANG UNIV
Why Eureka
Try Eureka