Low frequency broadening non-linear feedback control apparatus and method thereof
A nonlinear feedback and nonlinear control technology, applied in the direction of adaptive control, general control system, control/regulation system, etc., can solve problems such as instability, system structure instability, system performance change, etc.
- Summary
- Abstract
- Description
- Claims
- Application Information
AI Technical Summary
Problems solved by technology
Method used
Image
Examples
Embodiment 1
[0071] The input signal frequency is 1kHz, and the output signal of the sinusoidal signal with the amplitude of 1 after the nonlinear control module 2 is simulated as follows, the control model is Simulation parameters: the sampling frequency is taken as 10 times the signal frequency, The power spectrum of the signal itself and the signal after cx 2 、dx 3 , The output power spectrum simulation results are shown in (a), (b), (c) and (d) of Figure 4. (2) Use the last 2000 points of the output signal to reconstruct the phase space, the embedding dimension is set to 2, and the delay time is set to 5, 10, 15 and 20 respectively. Then the phase diagrams of the nonlinear control module 2 are shown in (a), (b), (c) and (d) of FIG. 5 .
[0072] From Figure 4 and Figure 5, it can be concluded that the more orders the signal passes through the nonlinear control module 2, the more the output spectrum components are, and the spectrum shifts to the high frequency band. It can be see...
Embodiment 2
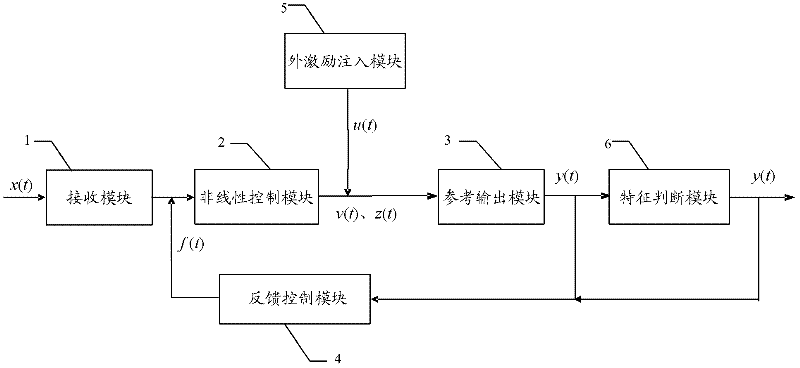
[0074] The block diagram of the control system is figure 1 As shown, there is no external excitation force acting on the system at this time Feedback control module 4 is output self-feedback process The input signal is a sinusoidal signal with a frequency of 1kHz and an amplitude of 1. The output signal after the nonlinear control module 2 is simulated as follows, the control model is Simulation parameters: embedding dimension time delay Take the last 2000 points for phase space reconstruction, the system output dynamics diagram is shown in Figure 6, and the time course diagram (a), power spectrum diagram (b) and phase diagram (c) of the feedback output signal are obtained by calculating the Lyapunov index Plot (d) of point i versus y(i).
[0075] From the time domain diagram and frequency spectrum diagram, after the signal is modulated, the amplitude and power spectrum value change greatly, and the phase diagram is still in a periodic state or a quasi-periodic stat...
Embodiment 3
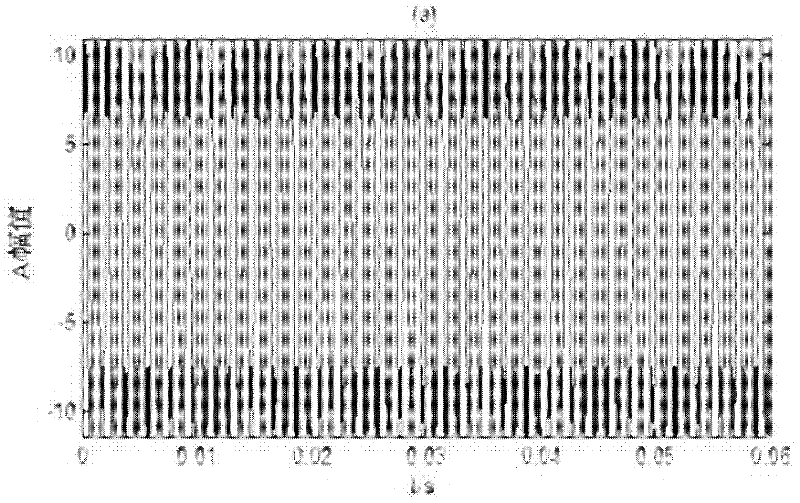
[0077] The structural block diagram of the control system is shown in Figure 1, and the feedback control module 4 is an output self-feedback process At this time, there is an external high-frequency excitation source act on the system. The input signal is a sinusoidal signal sin(2πft) with a frequency of 1kHz and an amplitude of 1, which is input to the nonlinear control module 2, and the control model is Simulation Parameters: Embedding Dimensions time delay Take the last 2000 points for phase space reconstruction, The time course diagram (a) of the output signal after feedback, the power spectrum diagram (b), the phase diagram (c), and the diagram (d) of points i and Ly obtained by calculating the Lyapunov index. The dynamic states when the amplitude of the external high-frequency excitation source is 10 and the frequency is 50kHz are shown in Figure 7;
PUM
 Abstract
Description
Claims
Application Information
 - R&D
- Intellectual Property
- Life Sciences
- Materials
- Tech Scout
- Unparalleled Data Quality
- Higher Quality Content
- 60% Fewer Hallucinations
Browse by: Latest US Patents, China's latest patents, Technical Efficacy Thesaurus, Application Domain, Technology Topic, Popular Technical Reports.
© 2025 PatSnap. All rights reserved.Legal|Privacy policy|Modern Slavery Act Transparency Statement|Sitemap|About US| Contact US: help@patsnap.com


