Accurate spectrum quantitative analysis method used for complex heterogeneous mixture system

A technique for quantitative analysis and mixtures, applied in the field of accurate spectral quantitative analysis

Inactive Publication Date: 2012-05-02
HUNAN UNIV
View PDF2 Cites 25 Cited by
  • Summary
  • Abstract
  • Description
  • Claims
  • Application Information

AI Technical Summary

Problems solved by technology

[0006] The technical problem to be solved in the present invention is, in order to overcome the existing method for eliminating the serious impact of the light scattering effect caused by the change of the physical properties of the sample on the quantitative analysis results of the spectral correction model, there are many limiting factors in practical applications (such as: requiring The sample spectrum has an interval that does not contain the spectral characteristics of chemical components, or it is required to obtain the pure spectra of all spectrally active chemical components in the sample first, etc.), a method that can combine the spectral contribution caused by the change of chemical component content with the sample A method for effectively separating spectral contributions caused by changes in physical properties to solve the problem of accurate spectral quantitative analysis of complex heterogeneous mixture systems

Method used


Image

  • Accurate spectrum quantitative analysis method used for complex heterogeneous mixture system
  • Accurate spectrum quantitative analysis method used for complex heterogeneous mixture system
  • Accurate spectrum quantitative analysis method used for complex heterogeneous mixture system

Examples


Embodiment 1

[0069] Embodiment 1: near-infrared spectroscopy is used for the mensuration of gluten content in wheat powder mixed sample

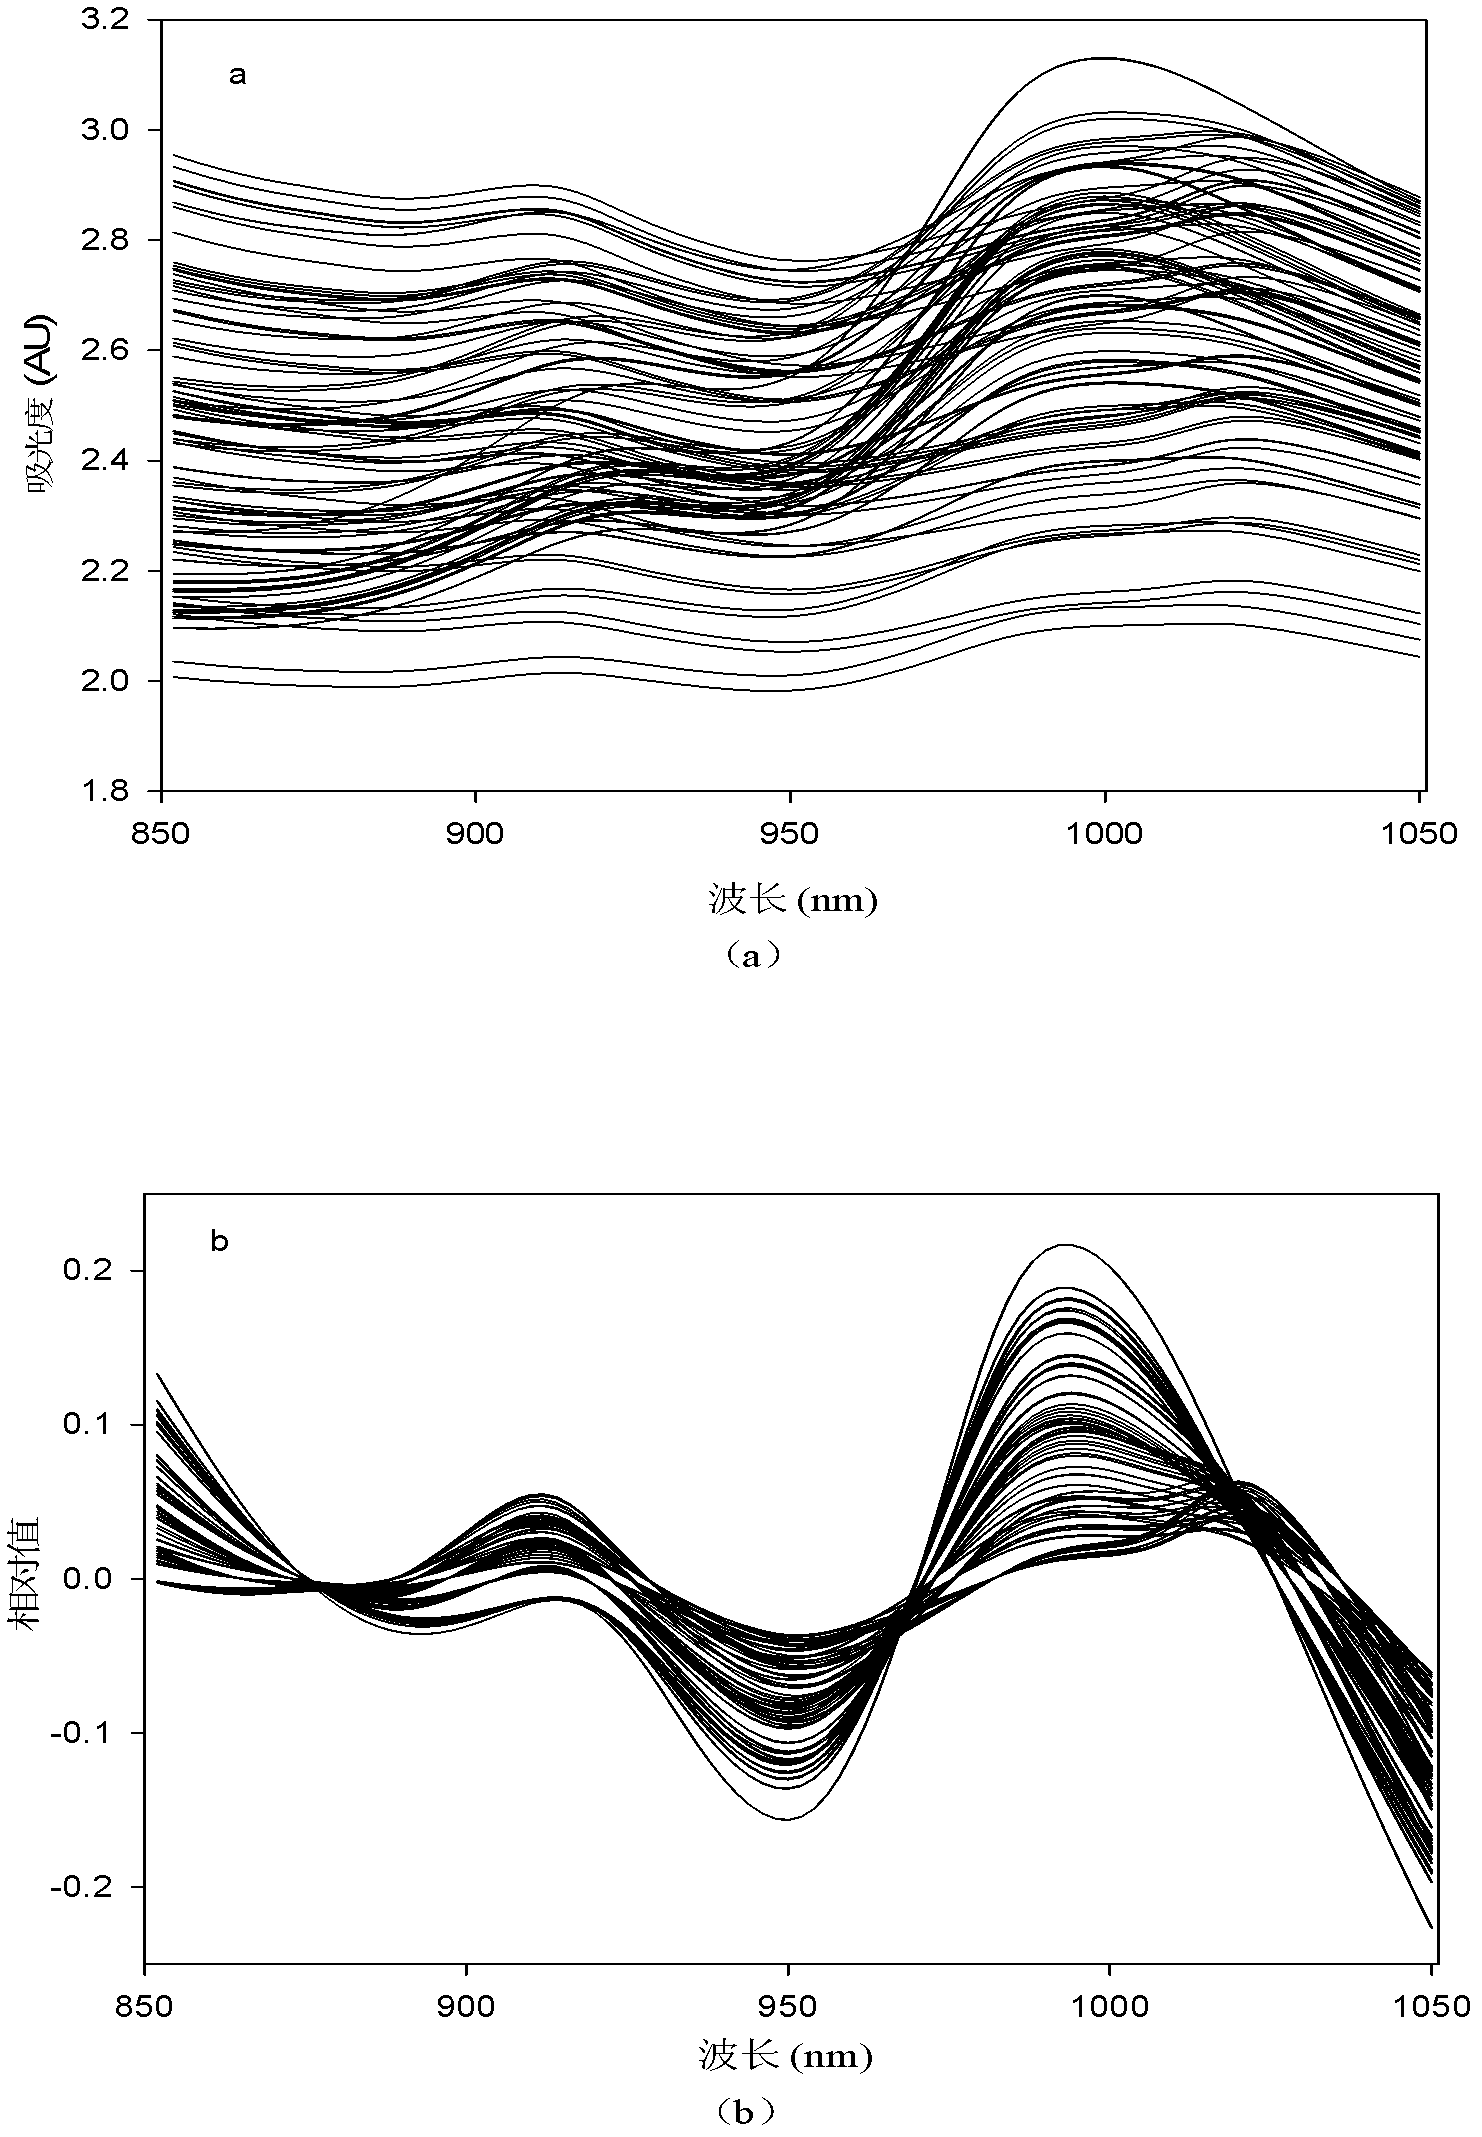
[0070] This embodiment uses a set of demonstration data (http: / / www.models.life.ku.dk / EMSCtoolbox) in the EMSC toolbox written by Professor Harald Martens to test that the present invention has a large change in the content of chemical components in the sample and Performance of systems with severe light scattering interference for quantitative determinations. The spectral data consisted of a total of 100 near-infrared transmission spectra of five wheat powder mixture samples whose mass ratios of wheat gluten and starch were 1:0, 0.75:0.25, 0.5:0.5, 0.25:0.75 and 0:1 ( Wavelength range: 850nm ~ 1050nm, wavelength interval: 2nm). Among them, each mixture was randomly sampled 5 times under two different packing degrees, and 2 near-infrared transmission spectra were collected each time, with a total of 20 spectra. The 60 spectra of the three mixtures whos...

Embodiment 2

[0080] Embodiment 2: Near-infrared spectroscopy is used for the determination of fat content in pork samples

[0081] This embodiment has used the pork sample near-infrared spectrum data (http: / / lib.stat.cmu.edu / datasets / tecator) disclosed by Sweden Tecator (TECATOR) company to test the present invention to complex heterogeneous mixture system The performance of the system for quantitative determination. The spectral data is composed of the spectra of 240 pork samples (wavelength range: 850-1050nm, wavelength interval: 2nm) measured on the Tekato Infratec Food and Feed Analyzer near-infrared spectrometer. The fat content (between 2% and 59%) of each pork sample was determined by the Soxhlet method. The spectral dataset is divided into a calibration set (129 samples), a validation set (43 samples), a test set (43 samples) and an extrapolation set (8 samples). In addition, this spectral dataset also includes an extrapolation set (7 samples) for the predicted proteins. Since t...


PUM


Abstract

The invention provides an accurate spectrum quantitative analysis method used for a complex heterogeneous mixture system. The method mainly comprises the steps of: 1) under certain spectrometer and experiment conditions, measuring the spectral data X of a calibration sample set; 2) calculating the light scattering multiplier effect vector p of the calibration sample set with the calibration sample set spectral data X and the concentration vector c of a corresponding target chemical component in a calibration sample; 3) establishing double calibration models: model I and model II among the calibration sample set spectral data X, multiplier effect vector p, and X as well as diag(c)p; 4) dividing a predicted value of the model II by a predicted value of the model I so as to obtain the concentration of the target component in the sample to be measured. The method of the invention realizes effective separation of a spectrum contribution caused by chemical component content change from a spectrum contribution caused by sample physical property change, and is an accurate spectrum quantitative analysis method used for a complex heterogeneous mixture system.

Description

technical field [0001] The invention relates to an accurate spectral quantitative analysis method for complex heterogeneous mixture systems, which belongs to the field of spectral and other instrument analysis and detection in industries such as chemical industry, food, pharmacy and environment. Background technique [0002] In recent years, due to the quantitative analysis and determination of heterogeneous mixture systems using traditional instruments such as high-performance liquid chromatography (HPLC), it often involves a very tedious and time-consuming sample pretreatment process, and spectral analysis techniques such as Fourier transform infrared spectroscopy and near-infrared spectroscopy , laser Raman spectroscopy, etc. are characterized by fast analysis speed, simple operation, simultaneous detection of multiple components, little need (or no need) for sample pretreatment, and non-destructive online monitoring (this is mainly due to commercial With the advantages o...

Claims


Application Information

Patent Timeline
Patent Type & Authority Applications(China)
IPC IPC(8): G01N21/25
Inventor 陈增萍金竞文俞汝勤
Owner HUNAN UNIV
Why Eureka
Try Eureka