

Loss prediction method for large-scale wind power-accessed power grid
A technology of access to the power grid and prediction method, applied in electrical components, circuit devices, AC network circuits, etc., can solve the problems of inability to effectively account for node injection power fluctuations and low network loss prediction accuracy.
- Summary
- Abstract
- Description
- Claims
- Application Information
AI Technical Summary
Problems solved by technology
Method used
Image

Examples
Embodiment 1
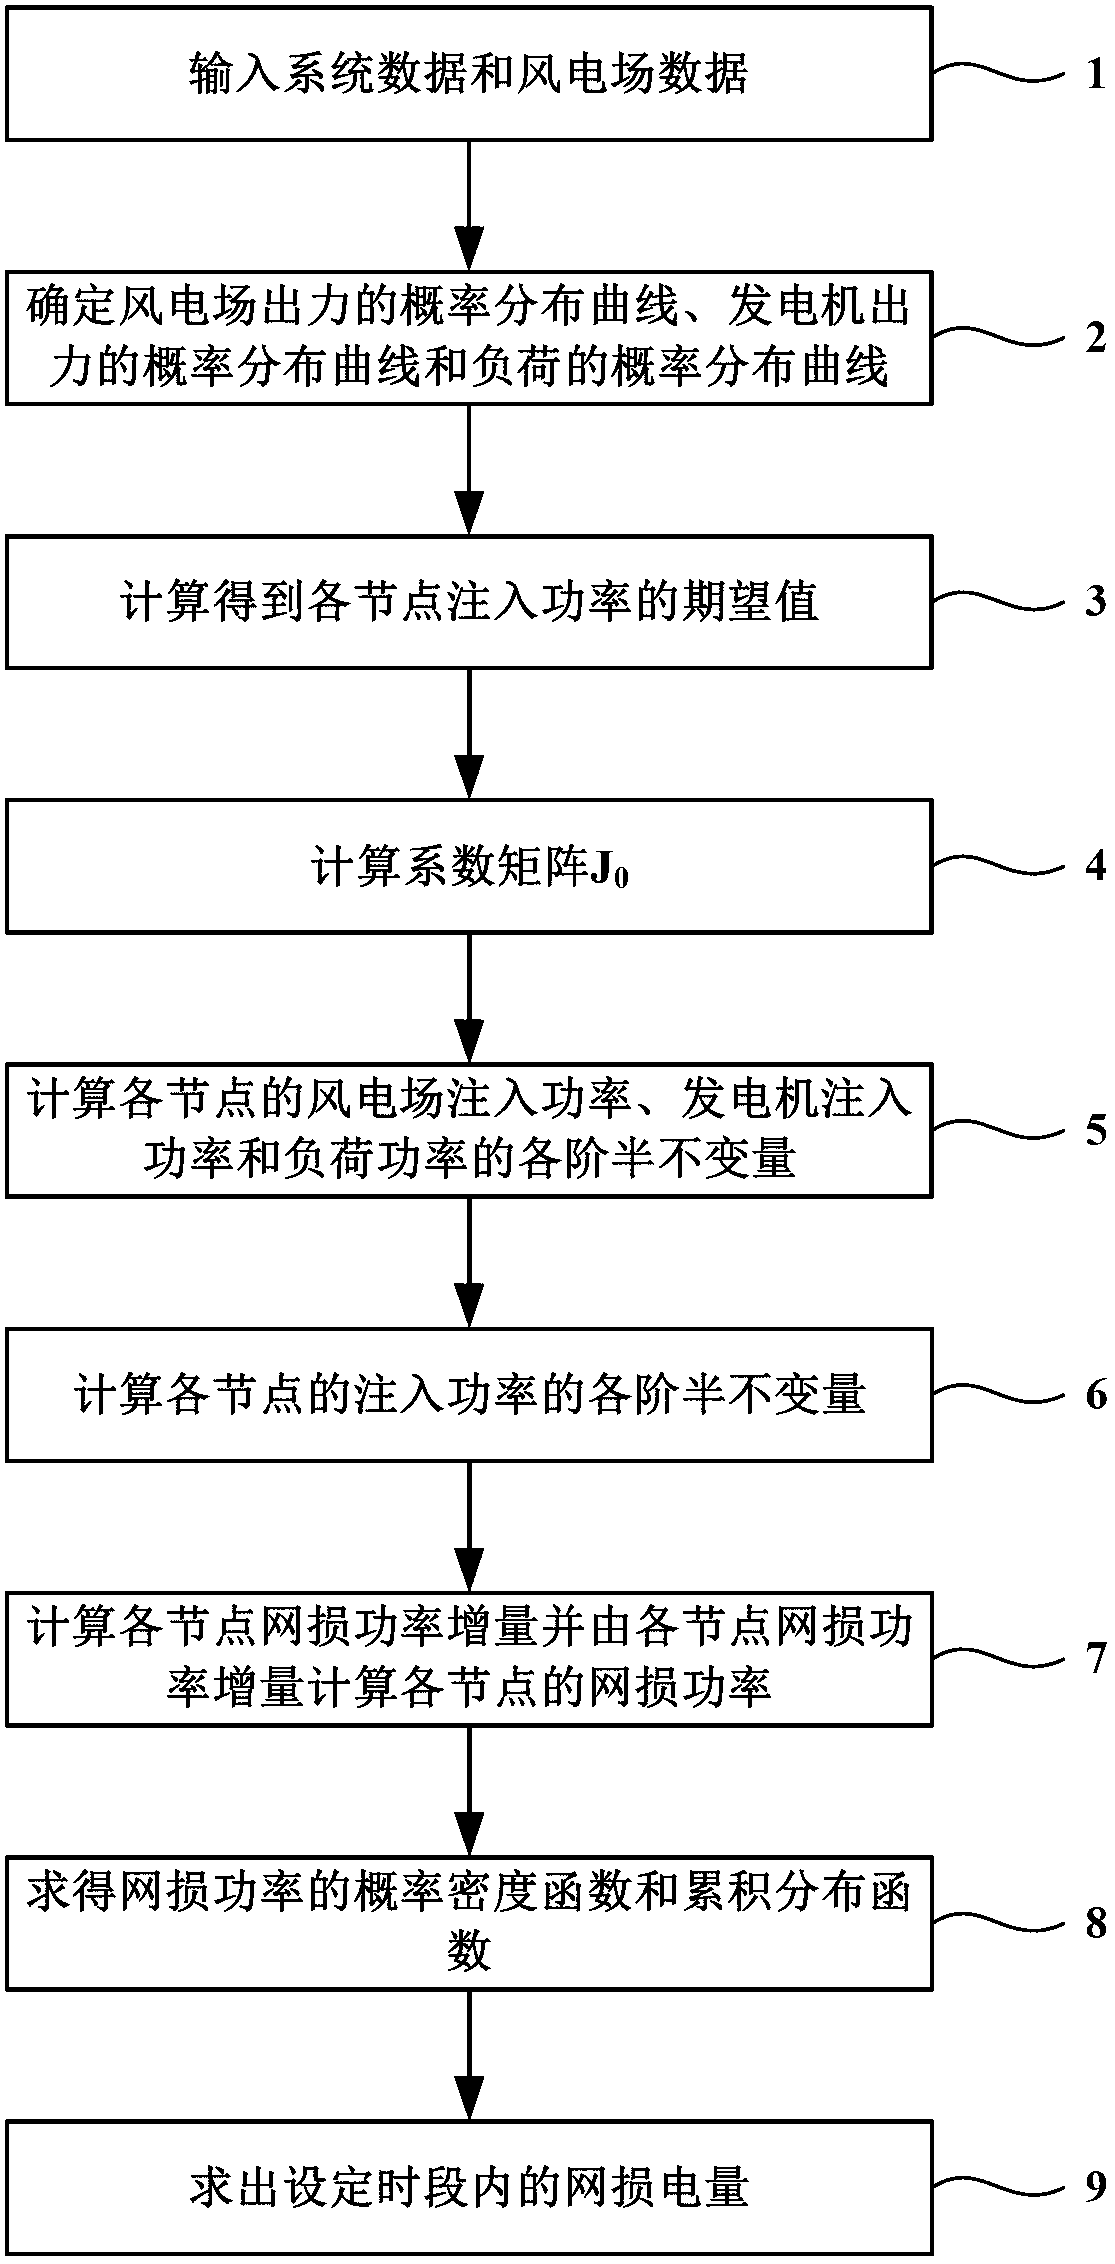
[0026] figure 1 It is a flow chart of the network loss prediction method after large-scale wind power is connected to the grid. figure 1 Among them, the network loss prediction method after the large-scale wind power is connected to the power grid provided by the present invention includes:
[0027] Step 1: Input system data and wind farm data, including the rated power of the wind turbine, the rated wind speed of the wind turbine, wind speed, cut-in wind speed, cut-out wind speed, wind speed distribution parameters, active output of the generator set, and normal operation of the generator set Probability, active output value of generator set in normal operation, expected value of load active power, variance of load active power and load active power value; the wind speed distribution parameters include shape parameters, scale parameters and location parameters.
[0028] Step 2: Determine the probability distribution curve of wind farm output, the probability distribution cur...
Embodiment 2
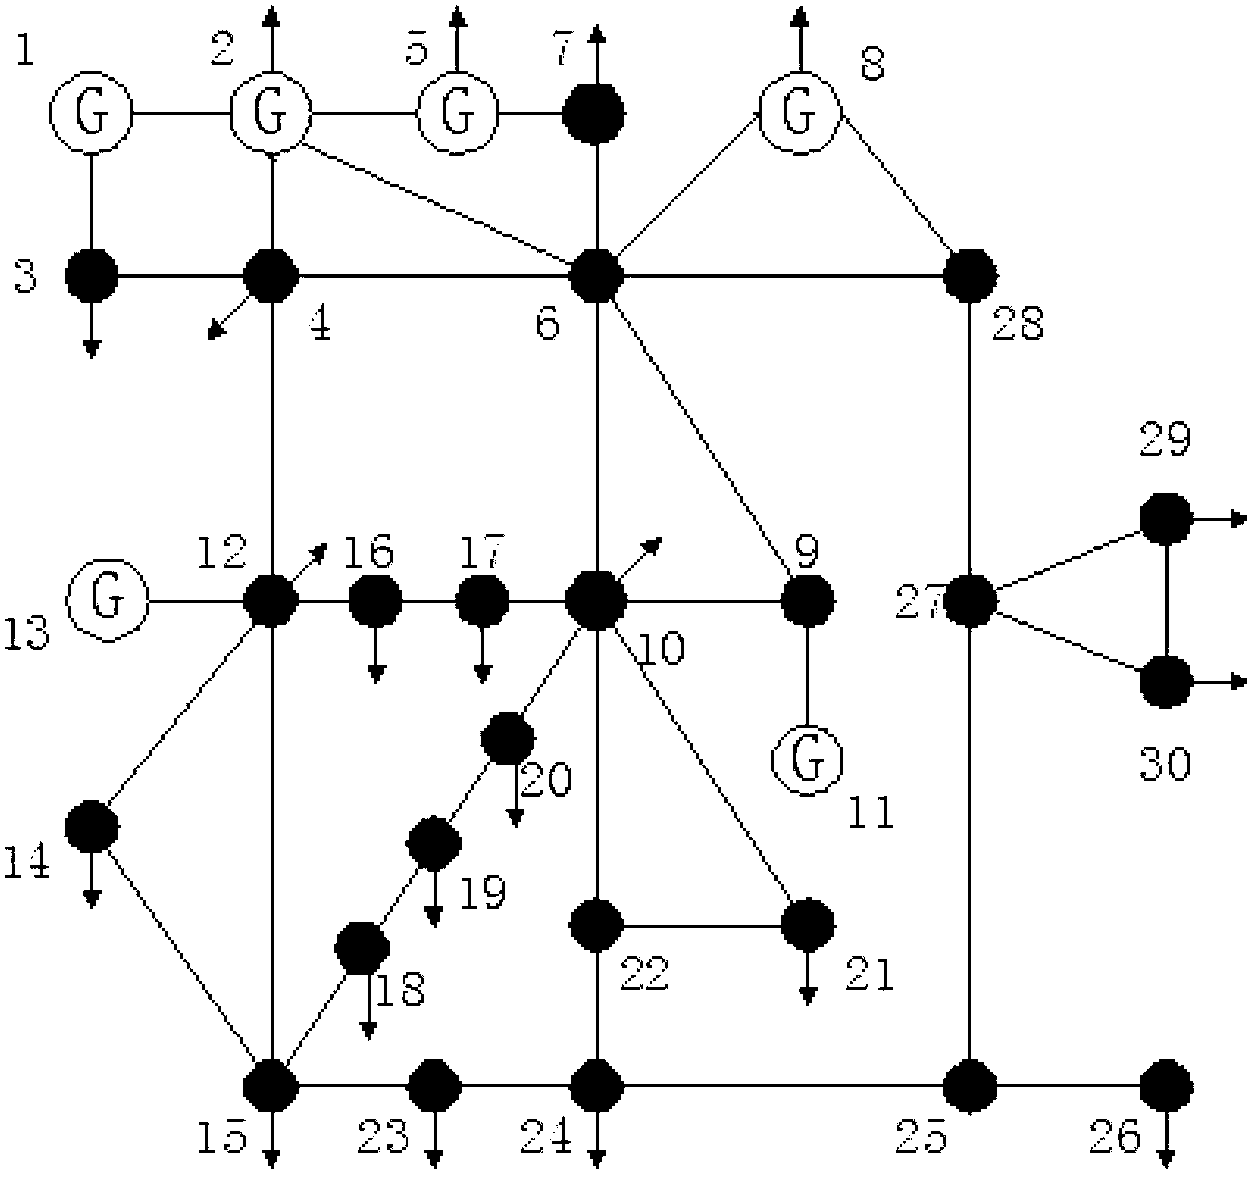
[0067] According to the above method, this embodiment adopts such as figure 2 IEEE 30-node system shown ( figure 2 is the system wiring diagram) as a verification model, the analysis is as follows:
[0068] It is assumed that the wind farm is connected to the 29th node of the IEEE30 power-saving system through a transformer and a 110kV line, and the line parameter of the wind farm access system is 12.6+j24.96Ω. The mathematical expectation of the injected power of each node of the system can be obtained from the probability distribution curves of wind farm output, generator output and load, as shown in Table 1.
[0069]
[0070] Table 1: Mathematical expectation of injected power at each node
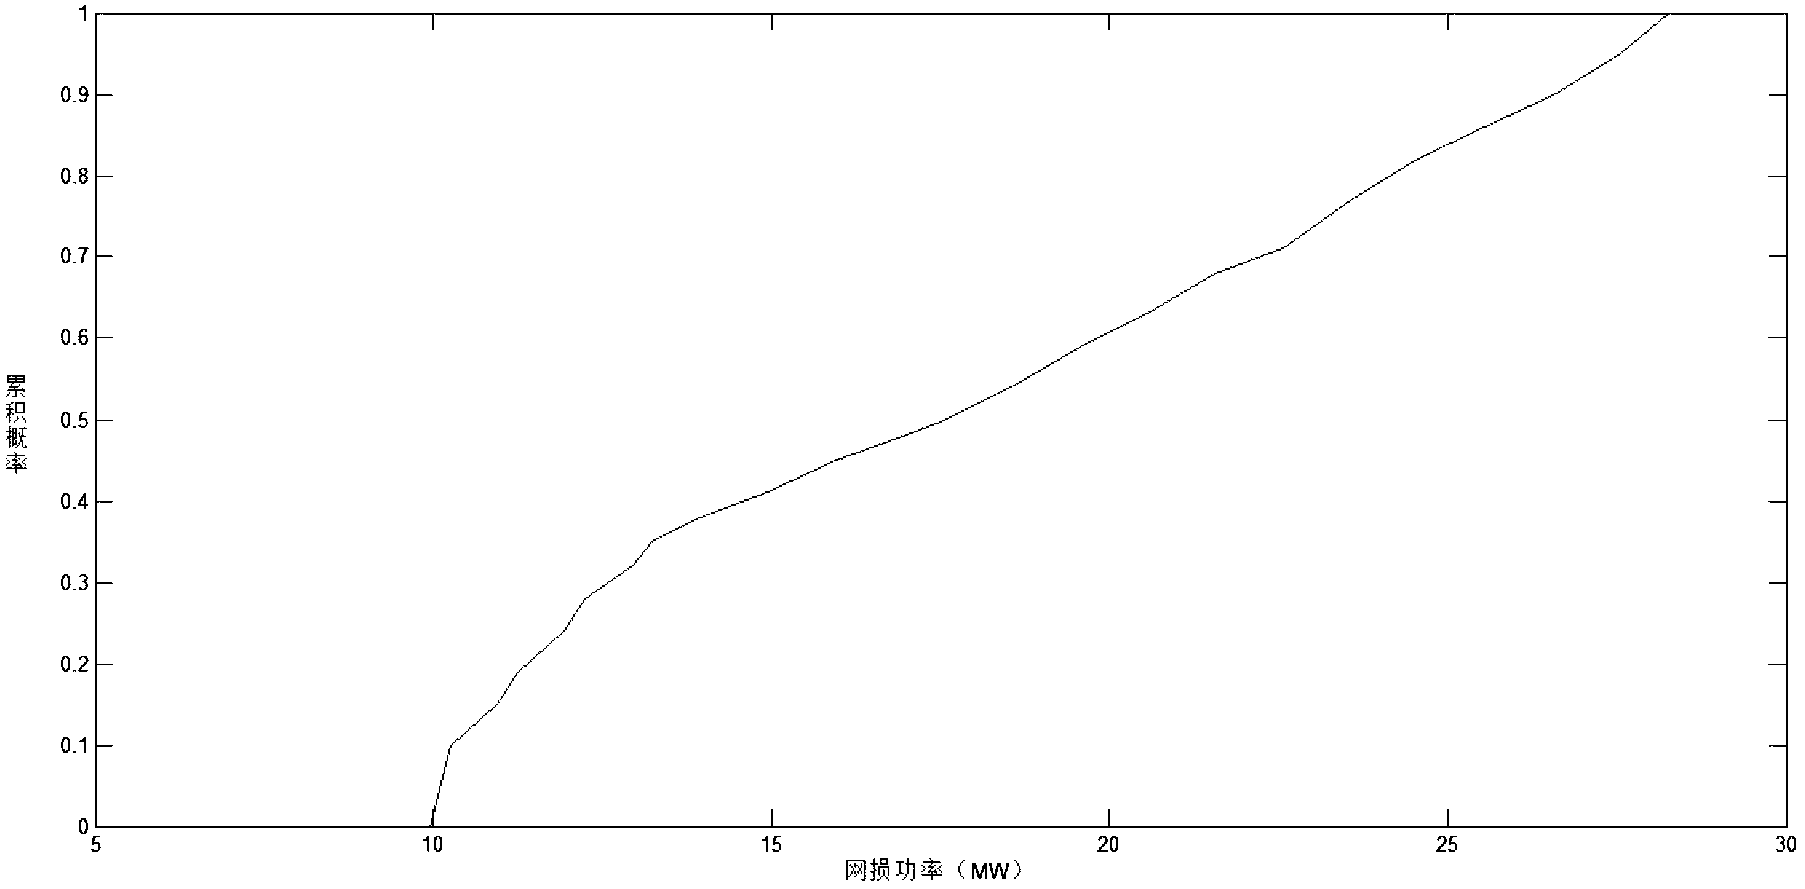
[0071] By calculating the semi-invariant of the network loss power, and using the Gram-Charlier series expansion to obtain the network loss probability distribution curve of the system in one day [0,24h] (h represents the hour) ( image 3 ), from which we can know the network lo...
PUM
 Abstract
Description
Claims
Application Information