
Method for embedding dynamic real-time monitoring chart in scalable vector graphics (SVG) interface

A real-time monitoring and chart technology, which is applied to the generation of dynamic real-time monitoring icons, and embedded in the field of dynamic real-time monitoring charts in the SVG interface, which can solve the problems of complex and changeable dynamic real-time monitoring interfaces, and achieve faster parsing and refreshing of SVG interfaces. The interface layout is fast and avoids the effect of coupling

Inactive Publication Date: 2013-04-10
JIANGSU XIDIANNANZI SMART ELECTRIC POWER EQUIP
View PDF3 Cites 20 Cited by
  • Summary
  • Abstract
  • Description
  • Claims
  • Application Information

AI Technical Summary

Problems solved by technology

It solves the construction problem of the complex and changeable dynamic real-time monitoring interface in the monitoring SVG interface, provides a method of embedding the defined and configured dynamic real-time monitoring interface into the SVG interface, and realizes the complex and changeable SVG monitoring interface with strong real-time performance Quick and easy layout editing and generation of display

Method used


Image

  • Method for embedding dynamic real-time monitoring chart in scalable vector graphics (SVG) interface

Examples


Embodiment Construction

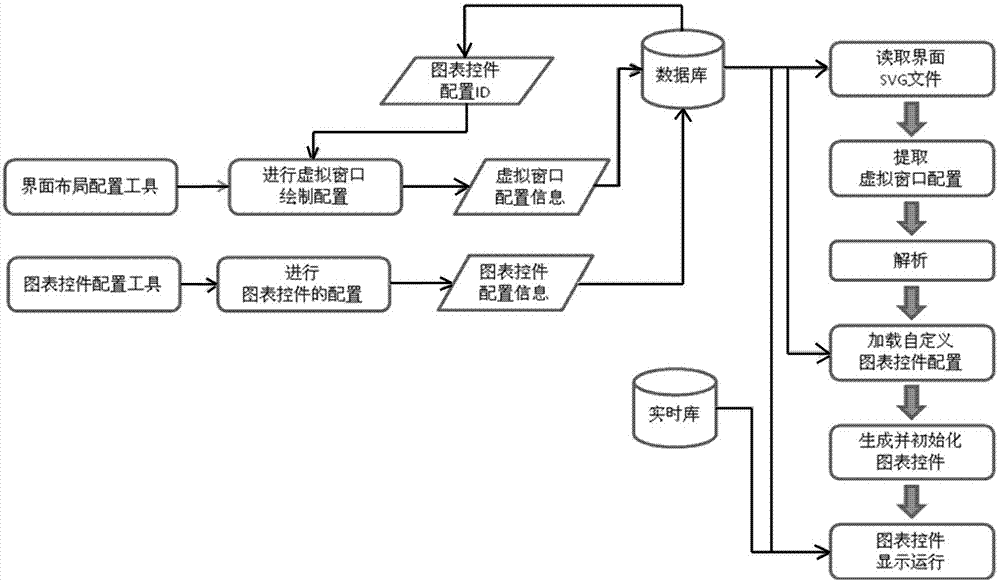
[0054] Refer to attached figure 1 The method for embedding a dynamic real-time monitoring chart in the SVG interface of the present invention comprises the following steps,

[0055] 1) Configure the real-time monitoring chart control, store the configured chart control in the database, and distinguish it with the unique chart control configuration ID. As long as the chart control configuration ID is provided, all the information related to the chart configuration can be retrieved.

[0056] The controls include chart title, type, channel number, channel associated data points, display coordinate axis unit, refresh sleep time, and the like.

[0057] The process of real-time monitoring chart control configuration includes:

[0058] 1.1) Edit the channel to generate a uniquely marked channel ID number; associate the data source of the channel, edit the name and description of the data channel, and then save it to the database for real-time monitoring chart control calls.

[0059...


PUM


Abstract

The invention belongs to the field of computer application, and relates to a generation method of a dynamic real-time monitoring icon, in particular to a method for embedding a dynamic real-time monitoring chart in a scalable vector graphics (SVG) interface. The method comprises the following steps that (1) a real-time monitoring chart control is configured, the configured chart control is stored into a database, and identity (ID) is configured through the only one chart control for differentiation; (2) a virtual window is drawn in an SVG monitoring picture, and layout is configured; and (3) the dynamic real-time monitoring chart is generated in the SVG monitoring interface. According to the method for embedding the dynamic real-time monitoring chart in the SVG interface, the definition and the configuration of the virtual window are realized; the dynamic real-time monitoring chart control is quickly inserted, positioned, associated and set in the SVG interface, and the virtual window is used for generating the dynamic real-time monitoring chart; an SVG document containing the virtual window is analyzed, and the SVG document in an XML format which contains the virtual window generates the monitoring interface; and the real-time monitoring chart is dynamically generated and displayed in the virtual window. The analysis and refreshing speed is accelerated, and the monitoring chart has rich functions, and is convenient and highly efficient.

Description

technical field [0001] The invention belongs to the field of computer applications, and relates to a method for generating a dynamic real-time monitoring icon, in particular to a method for embedding a dynamic real-time monitoring icon in an SVG interface. Background technique [0002] Power monitoring graphics can be divided into static graphics (explanatory text descriptions, connection texts, wiring diagrams, topology diagrams, etc.) and dynamic graphics (switch diagrams, current and voltage meters, status indicators, trend data curves, various real-time analysis charts, etc.). The Graphics Working Group of CCAPI was established in 2001, and suggested adopting XML-based scalable vector graphics SVG (Scalable Vector Graphics) as the standard for graphic exchange of power systems, which is being continuously applied in power systems. [0003] In the SVG specification, only basic graphics and drawing methods are provided, and there is no definition of standardized power ...

Claims


Application Information

Patent Timeline
Patent Type & Authority Applications(China)
IPC IPC(8): G06F9/44
Inventor 林俊李龙国胡华威周恒康蒋柳柳张丹丹
Owner JIANGSU XIDIANNANZI SMART ELECTRIC POWER EQUIP
Learn More