Contour delineation for radiation therapy planning with real-time contour segment impact rendering
A radiation therapy and contouring technology, applied in the field of image processing and radiation therapy, can solve the problems of occupying the precious time of professional medical personnel, cumbersome and time-consuming manual contour drawing and processing, etc.
- Summary
- Abstract
- Description
- Claims
- Application Information
AI Technical Summary
Problems solved by technology
Method used
Image

Examples
Embodiment Construction
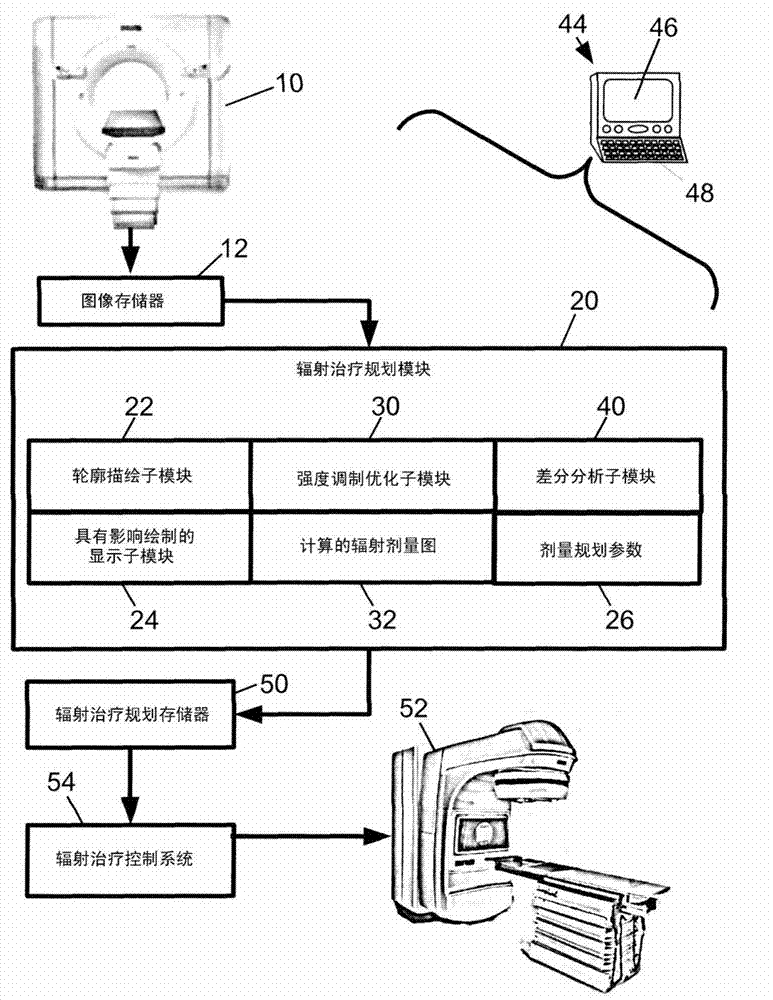
[0022] refer to figure 1 , the radiation therapy system includes an imaging modality 10 adapted to acquire planning images for planning radiation therapy. In some embodiments, the imaging modality 10 is a computed tomography (CT) scanner, such as a Brilliance TM Big Bore TM CT scanner (available from Royal Philips Electronics AG, Eindhoven, The Netherlands). The Brilliance TM Big Bore TM The CT scanner is an illustrative CT scanner with a large patient aperture of 85 cm, which is large enough to accommodate a patient placed in a typical radiation treatment position. Other CT scanners may be used instead, as well as other imaging modalities such as positron emission tomography (PET), magnetic resonance (MR), single photon emission computed tomography (SPECT), and the like. The captured images are stored in the image memory 12 . Planning images are preferably acquired of a subject scheduled to receive radiation therapy. For example, the subject may be a tumor patient,...
PUM
 Abstract
Description
Claims
Application Information
 - Generate Ideas
- Intellectual Property
- Life Sciences
- Materials
- Tech Scout
- Unparalleled Data Quality
- Higher Quality Content
- 60% Fewer Hallucinations
Browse by: Latest US Patents, China's latest patents, Technical Efficacy Thesaurus, Application Domain, Technology Topic, Popular Technical Reports.
© 2025 PatSnap. All rights reserved.Legal|Privacy policy|Modern Slavery Act Transparency Statement|Sitemap|About US| Contact US: help@patsnap.com