
Method for forecasting heavy rainfall by boundary aggregation method

A technology of heavy precipitation and boundary points, applied in the field of meteorology, can solve problems such as difficult judgment, difficult to determine, and unspecific size of the falling area

Active Publication Date: 2013-06-19
李平
View PDF2 Cites 6 Cited by
  • Summary
  • Abstract
  • Description
  • Claims
  • Application Information

AI Technical Summary

Problems solved by technology

[0015] The above-mentioned "north", "south", "right front", "left side", "slightly behind" and other geographical location analysis of the precipitation area, this is the analytical synoptic forecast of the heavy precipitation area , the above traditional forecasting method, the size of the landing area is not specific, it is not easy to determine, it is often predicted by the experience of technicians, and it is more difficult to judge the strength and landing point;

Method used


Image

  • Method for forecasting heavy rainfall by boundary aggregation method
  • Method for forecasting heavy rainfall by boundary aggregation method
  • Method for forecasting heavy rainfall by boundary aggregation method

Examples


Embodiment 1

[0045] Embodiment 1: It is the specific implementation steps of the present invention to use the initial field data at 08:00 on July 18, 2010 to make a 12-hour (process at 08:00 on July 19, 2010) system type heavy rainfall fall area forecast in Henan area:

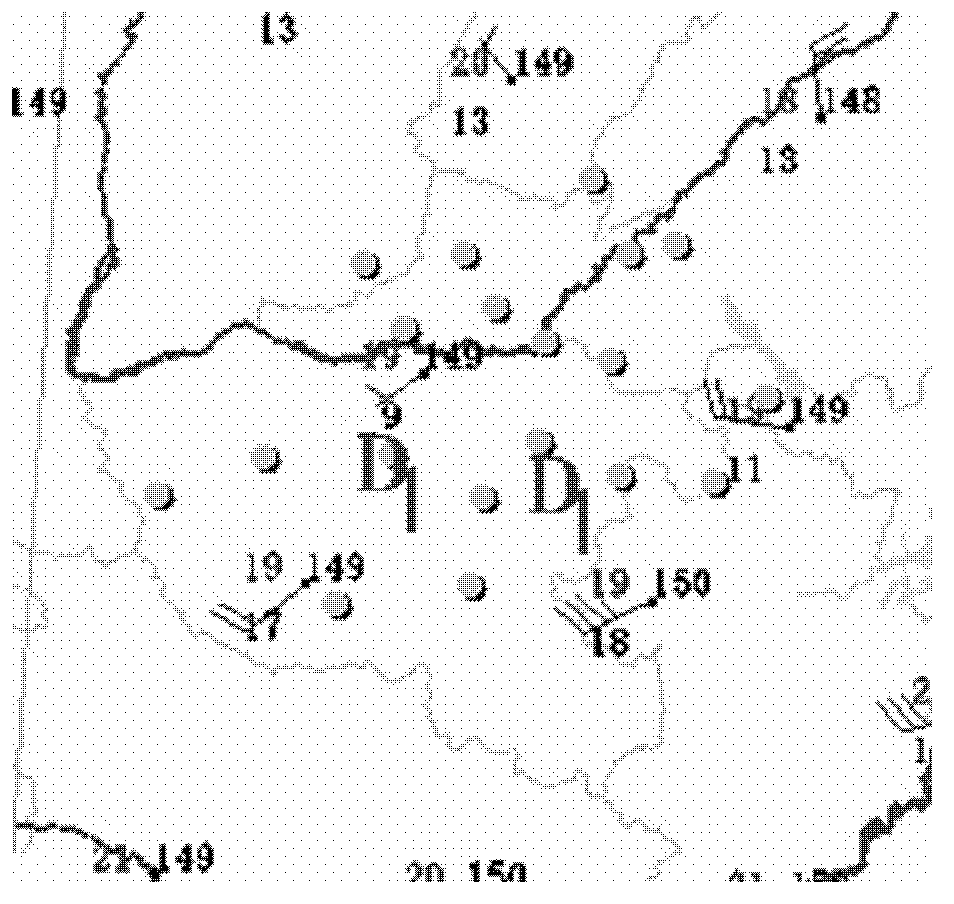
[0046] Step 1: Determine the interface layer: analyze the isobaric surface map data of the initial field (08:00 on July 18, 2010), and select the interface layer according to the above step 1). In this example, the temperature difference constant between any two stations is 4 degrees and 4 degrees The central point between the above two sites is the temperature difference boundary point on the interface layer (such as Figure 1A The solid point in ), select the 850 hPa isobaric surface diagram as the interface layer (M layer);

[0047] The second step: analyze the wind difference boundary point and the low vortex center point on the interface layer: according to the steps a and b in the above step 2), this example adopts t...

Embodiment 2

[0055] Embodiment 2: It is the concrete steps of the present invention's forecast Henan Province 2009.06.15.08 process:

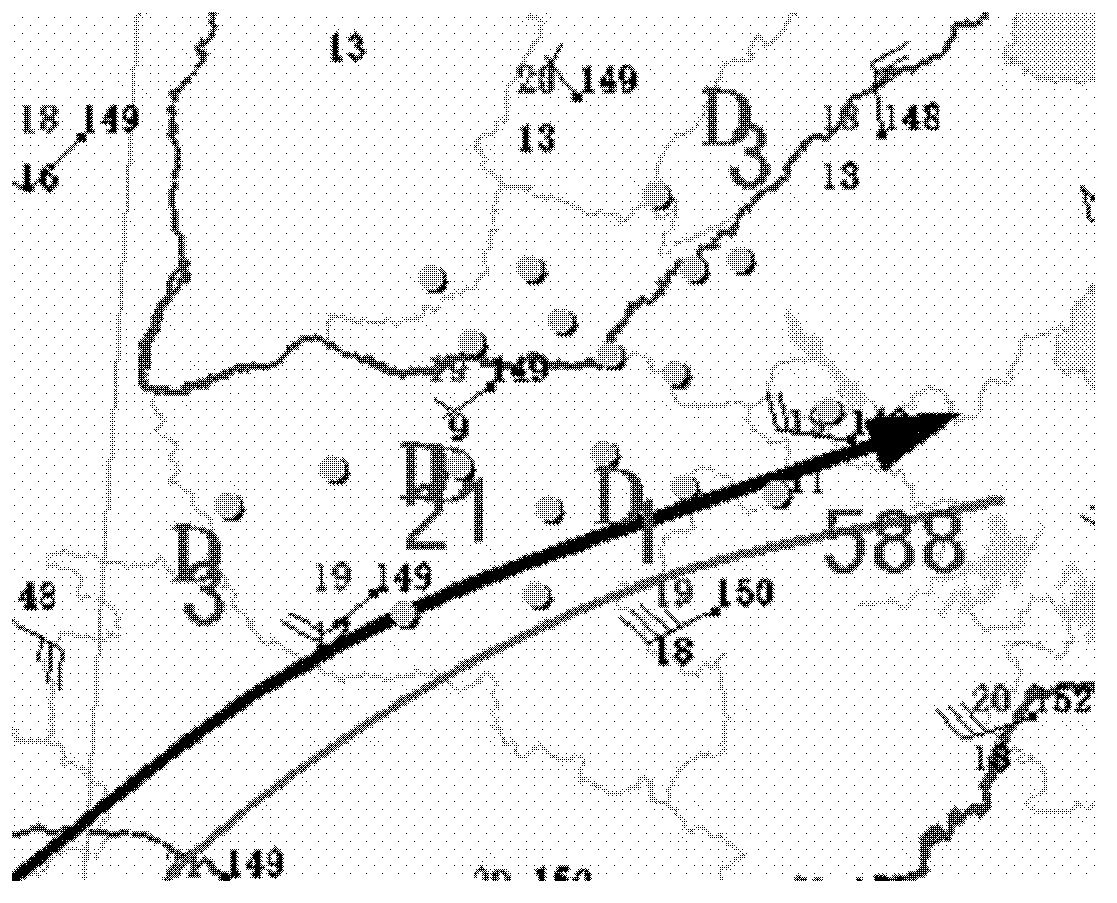
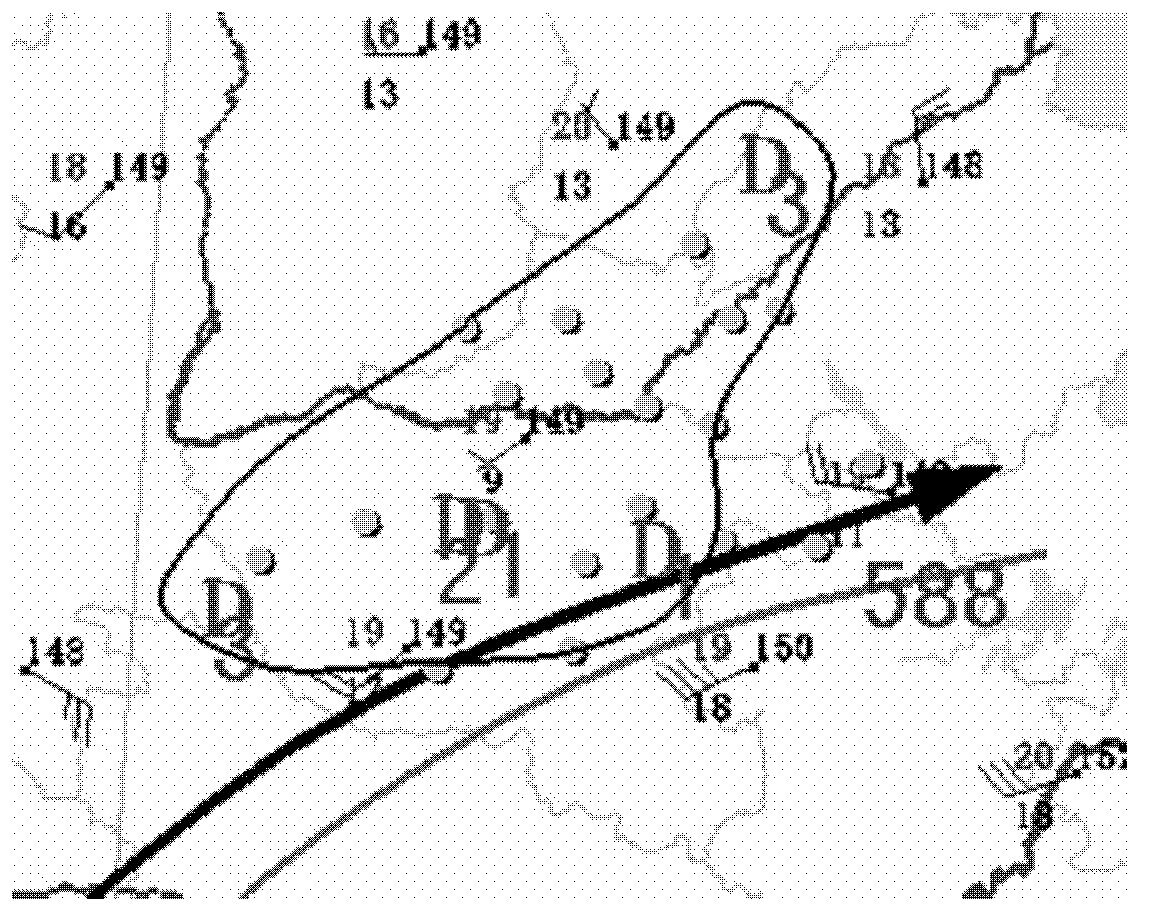
[0056] Step 1: Determine the interface layer: analyze the isobaric surface map data of the initial field (08:00, June 14, 2009), and select the interface layer according to step 1). In this example, the temperature difference constant between any two stations is 4 degrees or above The center point between the two stations is the boundary point of temperature difference on the interface (such as Figure 2A , the base map is the 850 hPa live map, and the solid point is the boundary point of the analysis), and the obtained 850 hPa pressure surface map is selected as the interface layer (M layer);

[0057] Step 2: Analyze the wind boundary point and low vortex center point on the interface layer: According to the analysis of steps a and b in the above step 2), it can be concluded that there is no wind boundary point and low vortex center point on the interface ...


PUM


Abstract

The invention relates to a method for forecasting heavy rainfall by a boundary aggregation method. By the method, the problem of forecasting the heavy rainfall can be solved effectively. According to the technical scheme, the method comprises the following steps of: 1, selecting a boundary layer; 2, analyzing bounded points on a boundary layer; 3, judging an aggregation area; and 4, dividing a heavy rainfall falling area. The invention provides a simple and objective method for performing mesoscale analysis by utilizing a weather map. By the method, a forecaster can forecast the heavy rainfall falling area without the reference of any numerical forecasting products and the calculation of physical quantity to improve the accuracy of the forecasting of torrential rain in the area; and the mesoscale analysis is performed on a specific isobaric surface according to the principles of frontogenesis kinematics and dynamics, and the bounded points are determined, so that the rainfall forecasting is performed by utilizing the aggregation area which are enclosed by the bounded points. Therefore, the method is a specific method for forecasting the heavy rainfall falling area by the boundary aggregation method.

Description

technical field [0001] The invention relates to the field of meteorology, in particular to a method for forecasting heavy precipitation using the boundary aggregation method. Background technique [0002] Affected by global warming, my country's disastrous weather is showing a trend of frequent occurrence, reoccurrence, and sudden occurrence, especially floods, mudslides, and urban fishing disasters caused by heavy rainfall are becoming more and more prominent, and their impact is also increasing For example, in August 1975, the Huaihe River Basin in southern Henan was affected by a typhoon and caused heavy rain and floods, resulting in the collapse of Banqiao, Shimantan and other reservoirs, and the collapse of Zhumadian Reservoir. Heavy rainfall not only caused huge economic losses, but even endangered the safety of people's lives; [0003] Our country attaches great importance to the development of meteorology. The success of numerical weather prediction is one of the most...

Claims


Application Information

Patent Timeline
IPC IPC(8): G01W1/10
Inventor 李平张金彬
Owner 李平
Learn More