Method using internal samples at reservoirs to carry out weighting and compile logging crossplot

A crossplot and well logging technology, applied in the field of exploration geophysics, can solve problems such as mismatching of sampling accuracy, inability to reflect core sample analysis values ​​one by one, logging parameter values, and failure to fully consider sample space information, etc., to improve accuracy, The effect of adding weight

Inactive Publication Date: 2015-04-15
NORTHWEST UNIV +2
View PDF4 Cites 0 Cited by
  • Summary
  • Abstract
  • Description
  • Claims
  • Application Information

AI Technical Summary

Problems solved by technology

[0003] It is assumed that based on the comprehensive analysis of well logging data and mud logging data, there are n reservoirs with core physical property analysis and test data in the target interval in the well in an oil area, and there are m core physical property analysis and test data in these n reservoirs samples, m≥n, then the number of samples in n reservoirs is m 1 , m 2 ,...,m n , then: m 1 +m 2 +…+m n = m, since the conventional logging sampling interval is 8 points / m, that is, the measurement interval of 0.125m, the minimum thickness of the strata that can be distinguished by the conventional logging series data is generally 0.5m, and there is an interface effect, while the actual core analysis small column sample diameter It is 2.5cm, and the length is 3~5cm. It can be seen that the sampling accuracy of the two data does not match. The logging data near the interface cannot reflect the logging parameter values ​​corresponding to the analysis values ​​of each core sample one by one, that is, they cannot be strictly followed. The core physical property analysis data adopts the acoustic logging data corresponding to the depth of single point data to compile the intersection map. How to organically correspond the core physical property analysis data and logging data to achieve the purpose of core calibration logging is a problem
Generally, according to the characteristics of well logging data, layer point analysis method is currently used to carry out arithmetic weighted average of the sample analysis and test values ​​inside n reservoirs, for example, the m in the first, second, ..., n layers 1 , m 2 ,...,m n The porosity values ​​of samples are respectively calculated as their arithmetic mean value, and the arithmetic mean value is recorded as p 1 ,p 2 ,...,p n , and then combine the acoustic time difference Δt of each layer corresponding to the n average values 1 , Δt 2 ,...,Δt n , to compile a sonic transit time-porosity logging crossplot, but the number of samples used in such a sonic transit time-porosity logging crossplot is n. In the process of compiling the crossplot, the difference in thickness of each layer and the The sample space information carried by the difference in the number of samples in layers does not fully reflect the typicality and representativeness of the samples.

Method used


Image

  • Method using internal samples at reservoirs to carry out weighting and compile logging crossplot
  • Method using internal samples at reservoirs to carry out weighting and compile logging crossplot
  • Method using internal samples at reservoirs to carry out weighting and compile logging crossplot

Examples


Embodiment 1

[0026] The method of using the internal samples of each layer to carry out weighting to compile the well logging crossplot, the steps are as follows:

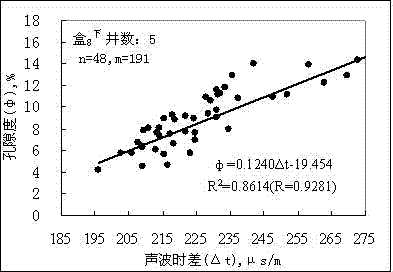
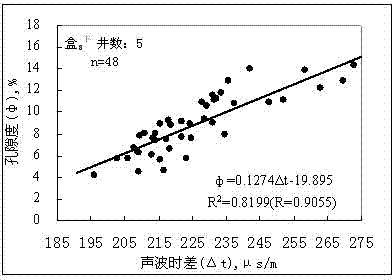
[0027] Step 1: First set the 5 well numbers of J33-22, J42-21, S231, W19-8 and Z43 in the target layer of the oil zone to be tested, and use a coring tool to test the target layer of the oil zone 191 cores were taken from the preset sampling depths in five wells whose well numbers were J33-22, J42-21, S231, W19-8, and Z43, and the 191 cores were tested with a physical property analyzer for the cores. The corresponding parameters, combined with the logging data and mud logging data of the corresponding core, under the condition of the sampling depth of the core as the analysis sample and the floating range set based on the sampling depth, optimally segmented according to the ordered quantity The method divides the target layer in the well into 48 reservoirs with layer numbers 1, 2, 3...48 respectively, and achieves that the logg...

Embodiment 2

[0033] The method of using the internal samples of each layer to carry out weighting to compile the well logging crossplot, the steps are as follows:

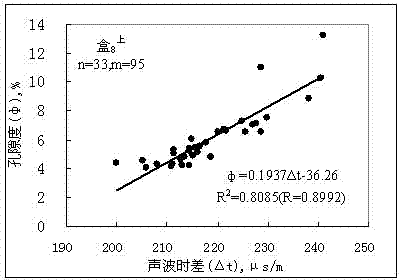
[0034] Step 1: First set the target layer that needs to be tested in the oil zone, use a coring device to take out 95 cores at the preset sampling depth in the target layer that needs to be tested in the oil zone, and use the physical property analysis for the 95 cores The corresponding parameters are tested by the instrument, combined with the logging data and mud logging data of the corresponding core, under the conditions of the sampling depth of the core as the analysis sample and the floating range set based on the sampling depth, according to the orderly In order to achieve optimal segmentation, the target layer in the well is divided into 33 reservoirs with layer numbers 1, 2, 3...33, and the logging attribute parameters inside each divided reservoir can be determined by one Acoustic time-difference logging parameter val...

Embodiment 3

[0040] The method of using the internal samples of each layer to carry out weighting to compile the well logging crossplot, the steps are as follows:

[0041] Step 1: First set the 18 wells of the target layer that need to be tested in the oil zone as shown in Table 3. In the wells corresponding to the well number, use the coring device to test the 18 wells in the target layer of the oil zone as shown in Table 3 251 cores were taken from the preset sampling depth of the well corresponding to the well number, and the corresponding parameters were tested by the physical property analyzer for the 251 cores, and combined with the logging data and mud logging data of the corresponding cores, Under the condition of the sampling depth of the rock core used as the analysis sample and the floating range set based on the sampling depth, the stratum of the target layer in the well is divided into layer numbers 1 and 2 according to the optimal segmentation of the ordered quantity , 152 re...


PUM


Abstract

A method using internal samples at reservoirs to carry out weighting and compile a logging crossplot includes the steps of fully considering the difference of quantity of core analysis samples of the reservoirs in oildom target stratums and the difference between logging information resolution ratio and core analysis sampling resolution ratio, and carrying out weighting processing on testing values of all the core analysis samples in the reservoirs. Through the processing, the method fully reflects the difference of thickness of each reservoir and the internal sample quantity, accords with requirements for sample space in statistics, and obviously improves drawing precision of the logging crossplot.

Description

technical field [0001] The invention belongs to the field of exploration geophysics, specifically belongs to the technical branch of well logging methods, and in particular relates to a method for preparing well logging intersection diagrams by weighting internal samples of each layer. Background technique [0002] With the continuous improvement of oil and gas field exploration and development, the complexity of geological targets and the difficulty of logging interpretation are becoming more and more difficult. Therefore, it is necessary to analyze various geological features and their frequency of occurrence in detail. In this way, not only the geological characteristics of reservoirs with various attributes need to be analyzed in detail, but also supporting technical methods are needed to extract and reflect their attributes. Logging crossplot is a key technology commonly used to characterize reservoir lithology, physical properties, oiliness and other characteristics. ...

Claims


Application Information

Patent Timeline
Patent Type & Authority Patents(China)
IPC IPC(8): G01V1/30G01V1/40
Inventor 张小莉冯乔申怡博程玉群张涛阎媛子黄薇巨银娟
Owner NORTHWEST UNIV
Why Eureka
Try Eureka