

Electric transmission line ice coating thickness monitoring method
A transmission line, ice thickness technology, applied in the field of electric power, can solve problems such as broken wires and inverted poles, image analysis, unstable relaxation, etc.
- Summary
- Abstract
- Description
- Claims
- Application Information
AI Technical Summary
Problems solved by technology
Method used
Image

Examples
Embodiment Construction
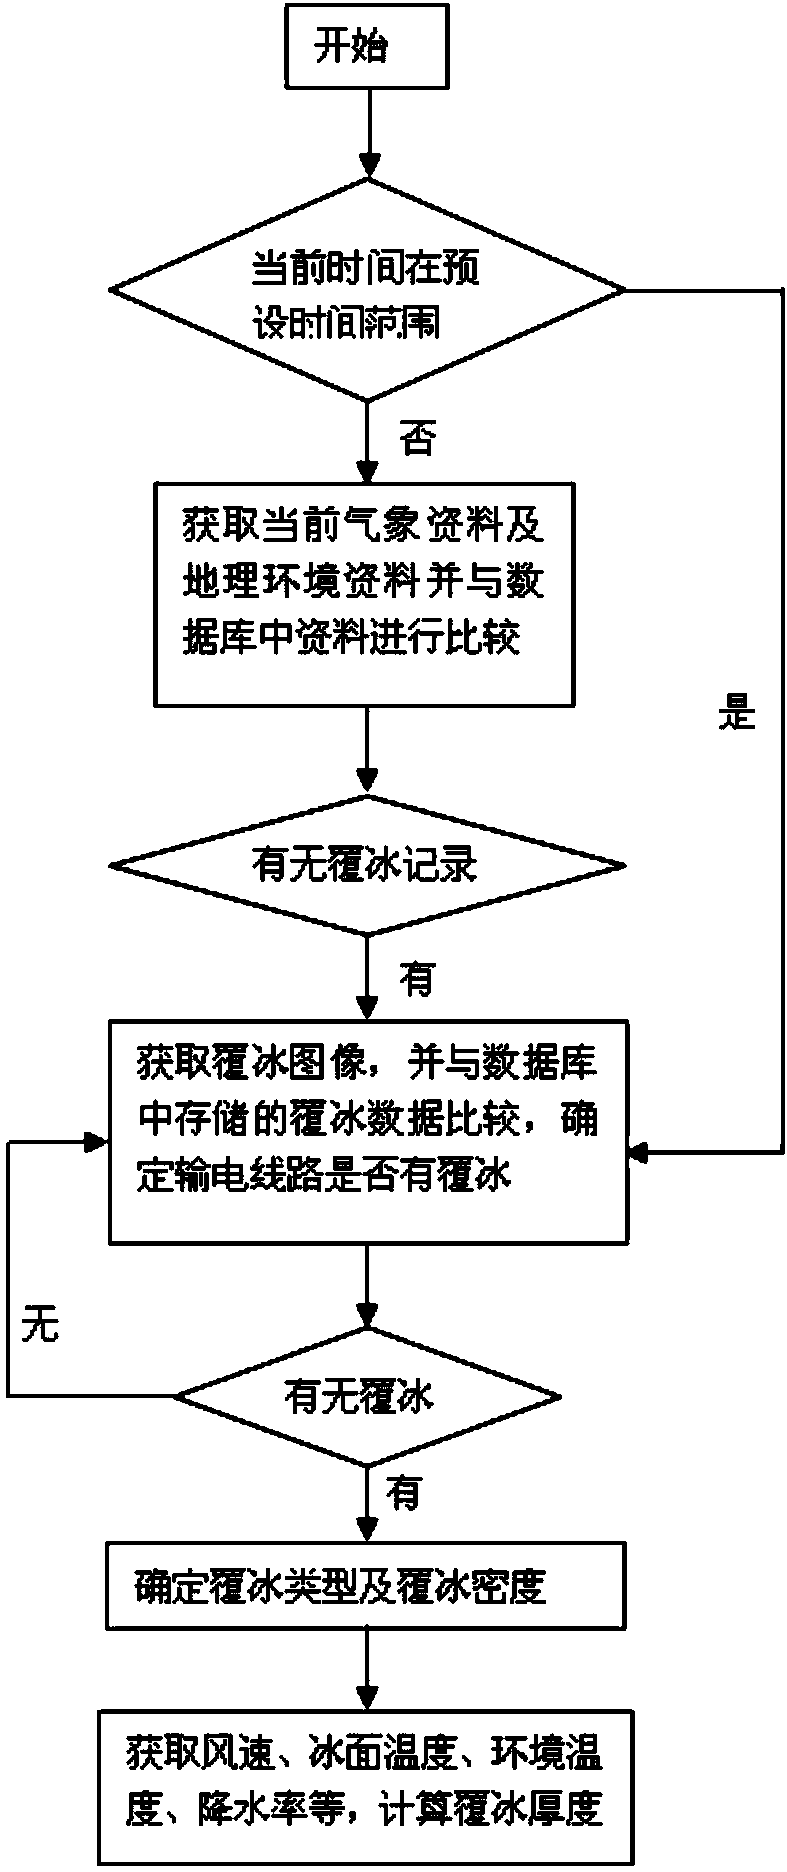
[0032] Such as figure 1 As shown, it is a flow chart of the method for monitoring the ice thickness of transmission lines provided by the present invention.
[0033]The method for monitoring the icing thickness of transmission lines provided by the present invention comprises the following steps:
[0034] (1) Obtain historical meteorological data, historical icing data and geographical environment data along the transmission line, and store them in the database; historical meteorological data include temperature, wind speed, relative humidity, and precipitation; historical icing data include icing Thickness, type of ice coating, weight of ice coating, shape characteristics and density of each type of ice coating. Different types of icing are produced under meteorological conditions and geographical environment; geographical environment data mainly refers to the altitude along the transmission line; establish a one-to-one correspondence relationship between historical meteorol...
PUM
| Property | Measurement | Unit |
|---|---|---|
| Density | aaaaa | aaaaa |
Abstract
Description
Claims
Application Information