
Bus congestion degree analysis method based on real-time data of bus GPS (Global Position System) and IC (Integrated Circuit) cards

A technology of GPS data and real-time data, applied in electrical digital data processing, special data processing applications, traffic flow detection, etc. Effect

Inactive Publication Date: 2014-04-16
汪涛
View PDF2 Cites 53 Cited by
  • Summary
  • Abstract
  • Description
  • Claims
  • Application Information

AI Technical Summary

Problems solved by technology

The distance sensor and the crowded button often cannot be accurately judged in the case of a large bus passenger flow, and there is a large error, and as time goes by, the error will further expand

Method used


Image

  • Bus congestion degree analysis method based on real-time data of bus GPS (Global Position System) and IC (Integrated Circuit) cards
  • Bus congestion degree analysis method based on real-time data of bus GPS (Global Position System) and IC (Integrated Circuit) cards
  • Bus congestion degree analysis method based on real-time data of bus GPS (Global Position System) and IC (Integrated Circuit) cards

Examples


Embodiment Construction

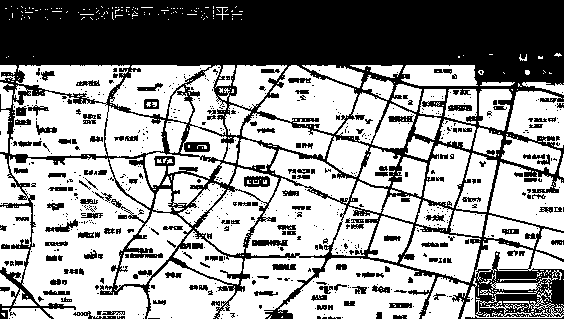
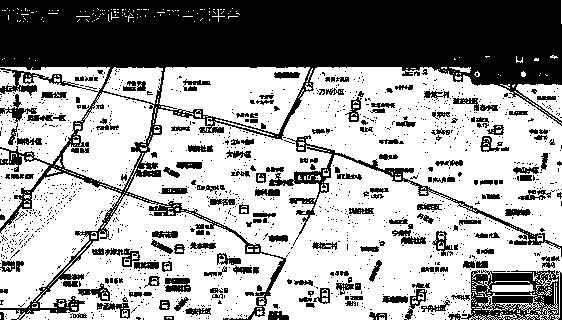
[0043] Please refer to the accompanying drawings, take the public transport system of Ningbo as the analysis object, and specifically set forth the bus congestion analysis method of the present invention.

[0044] As shown in the figure, the present invention provides a bus congestion analysis method based on the GPS and IC card real-time data of the bus. The following specifically illustrates how to analyze the bus congestion.

[0045] The present invention uses Ningbo bus GPS and IC card real-time data as a data source, and establishes a historical quality database through historical data feature analysis, and then screens the bus GPS and IC card data acquired in real time, repairs wrong data and mines valid data. Then, data fusion is performed on the high-quality bus GPS and IC card real-time data after preprocessing to obtain bus network data such as bus route direction, station location, bus station facilities, as well as bus passenger flow data such as passenger alighting...


PUM


Abstract

The invention discloses a bus congestion degree analysis method based on real-time data of a bus GPS (Global Position System) and IC (Integrated Circuit) cards. The bus congestion degree analysis method comprises step 1, establishing a historical quality database according to data of the bus GPS and historical data of the IC cards, performing real-time data screening and recovery and mining effective data; step 2, performing data fusion and establishing a bus trip real-time information table of residents; step 3, calculating the real-time bus route passenger flow OD distribution according to a traffic model; step 4, performing partition on threshold values of the bus congestion state and performing the bus congestion degree analysis on bus stops and bus routes respectively based on the obtained real-time bus route passenger flow OD distribution. According to the bus congestion degree analysis method based on the real-time data of the bus GPS and the IC cards, the validity, reliability and accuracy of the data can be improved and the important data basis is provided for the improvement of the utilization rate of the public transport.

Description

technical field [0001] The invention relates to a bus congestion analysis method based on bus (electric) car GPS and IC card real-time data, and belongs to the application field of intelligent traffic information technology. Background technique [0002] As the main mode of urban transportation, public transportation has been favored by the majority of traffic travelers. However, public transportation still has many problems. Which bus stop is congested? Which line is congested? Where are the bus lines congested? These issues are the daily concerns of traffic travelers. Because travelers do not have enough information, they generally judge the bus congestion situation based on their own experience. Due to the lack of accurate data basis and the OD of bus passenger flow is generally dynamic, this judgment is often very inaccurate. [0003] The invention patent with the application number 201110111146.X "a method for detecting the degree of congestion in a bus" uses a di...

Claims


Application Information

Patent Timeline
IPC IPC(8): G08G1/01G06F17/30
Inventor 汪涛
Owner 汪涛
Learn More