Transmission line malfunction visualized report method and system based on Web and GIS

A technology for transmission lines and faults, applied in the field of visual notification, can solve the problem that the dispatcher cannot meet the needs of real-time and accurate control of power grid operation status information, etc., and achieve the effect of improving intuitive cognition.

Inactive Publication Date: 2014-06-04
STATE GRID CORP OF CHINA +1
View PDF7 Cites 40 Cited by
  • Summary
  • Abstract
  • Description
  • Claims
  • Application Information

AI Technical Summary

Problems solved by technology

[0004] However, these limited visualization methods can no longer meet the needs of dispatc

Method used


Image

  • Transmission line malfunction visualized report method and system based on Web and GIS
  • Transmission line malfunction visualized report method and system based on Web and GIS

Examples


specific Embodiment approach

[0036] The specific embodiment: the specific embodiment of the present invention is described in detail below in conjunction with accompanying drawing:

Embodiment

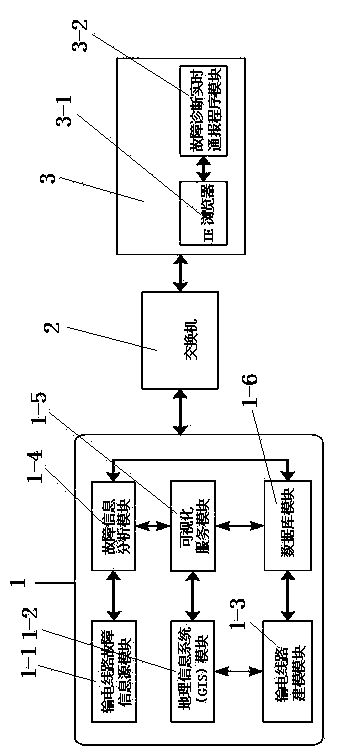
[0037] Embodiment: a kind of transmission line failure visualization notification system based on Web and GIS (see figure 1 ), which includes obtaining transmission line fault information and locating the fault to specific towers, and providing Web service end 1 combined with satellite maps; switch 2 for connecting Web service end 1 and client 3; for transmission line fault visualization Client 3 shown; Web server 1 and client 3 are all connected to switch 2 through network cables.

[0038] Web server 1 includes transmission line fault information source module 1-1, geographic information system (GIS) module 1-2, transmission line modeling module 1-3, fault information analysis module 1-4, visualization service module 1-5, Database modules 1-6. The fault information analysis module 1-4 is connected to the transmission line fault information source module 1-1, the visualization service module 1-5 and the database module 1-6; the visualization service module 1-5 is connected to...


PUM


Abstract

The invention discloses a transmission line malfunction visualized report method and system based on a Web and a GIS. The system comprises a web server side (1), a switch (2) and a client side (3). The web server side (1) is used for acquiring transmission line malfunction information, locating a malfunction to a specific tower, and providing Web services by combining a satellite map. The switch (2) is used for enabling the web server side (1) and the client side (3) to be connected. The client side (3) is used for visualized displaying of the transmission line malfunction. After electric transmission lines of a power grid break down, the system is triggered to work, the Web service side locates the malfunction tower position and generates an XML file after malfunction information computational analysis, and provides Web services to the client side (3) to carry out visualized displaying of the malfunction information. According to the transmission line malfunction visualized report method and system based on the Web and the GIS, the transmission line malfunction information is displayed visually in real time, the visual cognition degree of power transmission network malfunctions is improved, the capacities that power enterprise personnel display important information in a large amount of power system data and monitor the states of the power grid can be improved, and the reliability of the system is guaranteed.

Description

Technical field: [0001] The invention relates to a visual notification method and system, in particular to a Web and GIS-based transmission line fault visualization notification method and system. Background technique: [0002] Visualization is a new technology that emerged with the development of computer technology. It converts some complicated text and data into intuitive graphics and images, helping people to understand the meaning of data or process visually, and even the physical process. In essence, it is the supplement and improvement of data or text expression. Information visualization is the use of computer-supported, interactive, and visual representations of abstract data to enhance people's cognition of these non-physical abstract information. Power grid information visualization is the intersection and extension of electric power science and computer technology, geographic information science, ergonomics and other disciplines, and it is the expansion and deve...

Claims


Application Information

Patent Timeline
IPC IPC(8): G01R31/08G06F17/30
Inventor 张昀王邦惠鲍忠伟孙祝寿申永强王连成丛忠财盛春来郝红
Owner STATE GRID CORP OF CHINA
Why Eureka
Try Eureka