Indicator sampling rate automatic switchover method

A technology of sampling rate and dynamometer, which is applied in construction and other fields, can solve problems such as difficult signal cycle, long signal acquisition time, error amplification, etc., and achieve the effect of avoiding excessive power consumption

Active Publication Date: 2014-07-16
北京必创科技股份有限公司
View PDF10 Cites 6 Cited by
  • Summary
  • Abstract
  • Description
  • Claims
  • Application Information

AI Technical Summary

Problems solved by technology

And between 0.025 and 0.2 Hz, after any slight deviation calculated on the frequency and the current frequency is converted into a period, the error will be greatly amplified, which cannot meet the 0.1 second requirement proposed by the oil field
To achieve the required time accuracy, the signal acquisition time will be unacceptably long, which is obviously unrealistic
[0011] For these extremely low-frequency signals, two methods are usually used to estimate the sampling period in the prior art. One is to convert the original signal similar to a sine wave into a square wave through zero-crossing comparison, and then measure The square wave pulse width method is used to obtain the signal period. Since some pulses on the acceleration signal measured by the dynamometer are even higher than the periodic sine wave signal, it is difficult to obtain the correct signal period through this zero-crossing comparison method.
Another method is to fit a straight line passing through the zero-crossing point after determining the zero-crossing point, obtain the slope of the straight line by the least square method, and then obtain the signal period according to the slope of the straight line. Therefore, the graph of the signal is not a complete sine wave, and the uplink and downlink peaks are somewhat eccentric, so it is difficult to obtain the correct period by this method
[0012] However, in the existing dynamometers, the stroke period of the pumping well is usually only calculated by the method of frequency domain analysis, and because the data length and the order of frequency domain analysis have a certain impact on the resolution, the stroke period is used as the sampling period Sampling is not accurate, and when there are too few sampling points in the actual stroke cycle, accurate sampling data cannot be obtained to form an accurate power diagram. When there are too many sampling points, the power consumption of the dynamometer will be too large, which will affect the power display Instrument life

Method used


Image

  • Indicator sampling rate automatic switchover method
  • Indicator sampling rate automatic switchover method
  • Indicator sampling rate automatic switchover method

Examples


Embodiment Construction

[0037] The principles and features of the present invention are described below in conjunction with the accompanying drawings, and the examples given are only used to explain the present invention, and are not intended to limit the scope of the present invention.

[0038] The present invention is realized based on the following considerations:

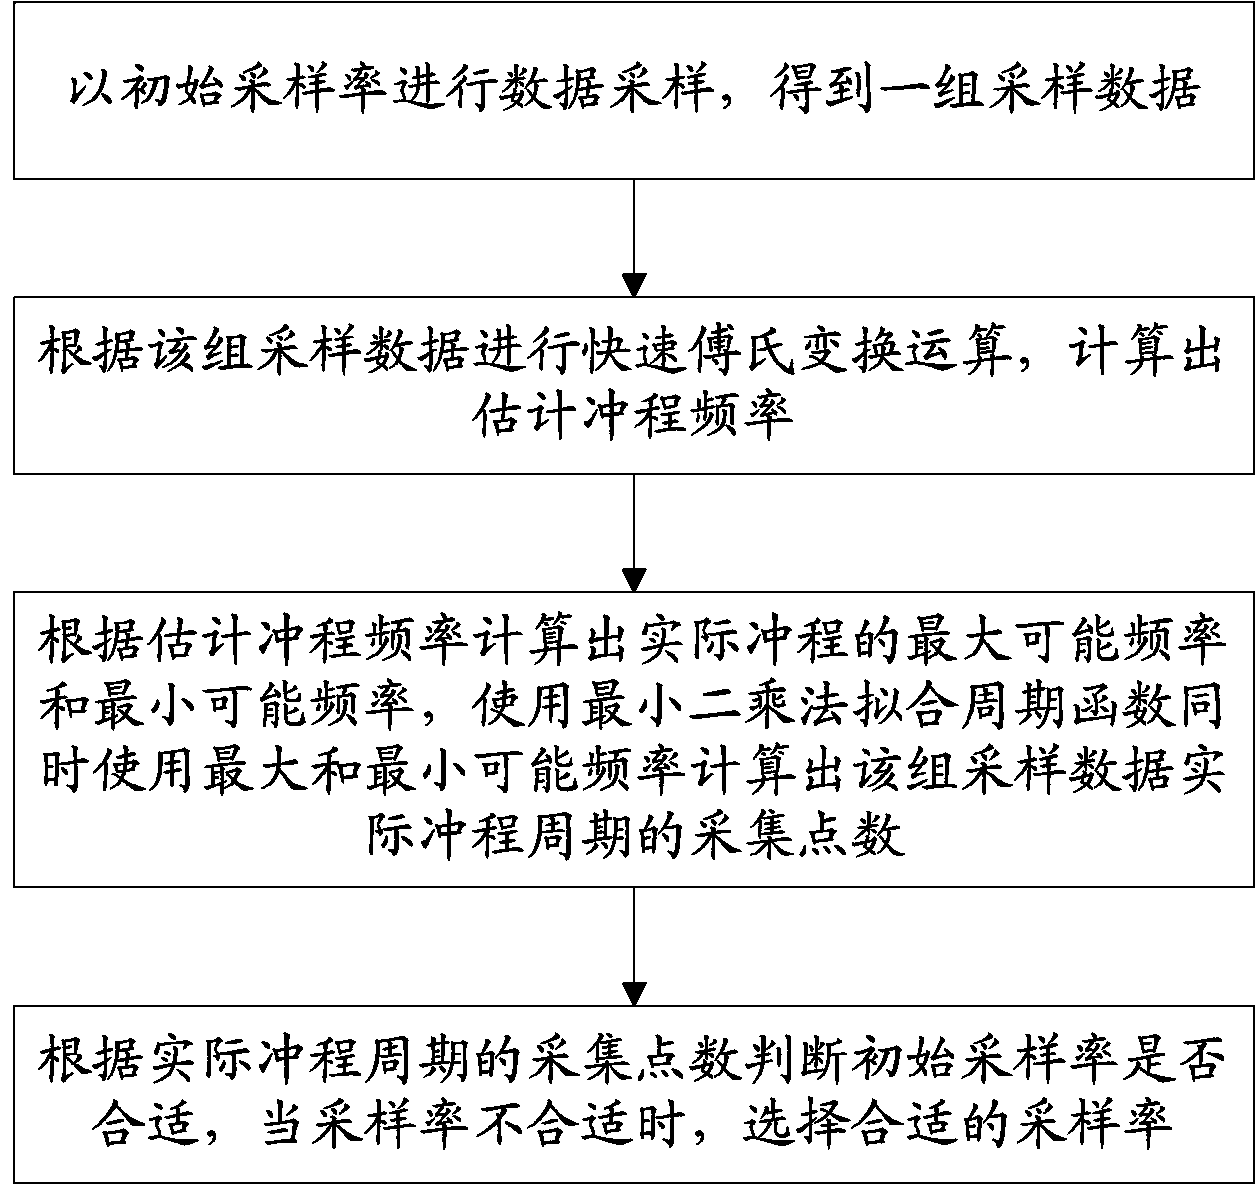
[0039] For a fixed pumping well, its actual stroke cycle will not change for a period of time. In other words, two adjacent actual stroke cycles can be the same by default, and the sampling signal of the indicator diagram is the frequency Very low periodic signal. For the pumping unit whose initial sampling rate is known, the actual stroke frequency range of the pumping unit can be estimated based on the above objective conditions, and then the sampling rate of the dynamometer can be adjusted by accurately estimating the collection points of the actual stroke cycle of the dynamometer diagram.

[0040] The invention provides a method f...


PUM


Abstract

The invention discloses an indicator sampling rate automatic switchover method. According to the indicator sampling rate automatic switchover method, the maximal possible frequency and the minimal possible frequency of the actual stroke of an indicator diagram are calculated according to an indicator diagram estimation stroke frequency, fitting is conducted on a periodic function through the least square method, an actual stroke periodic sampling point number, calculated according to the maximal possible frequency and the minimal possible frequency, of a set of sample data is contrasted with a preset single-period sampling point number range value of an indicator, the sampling rate of the indicator is adjusted timely, as a result, an accurate indicator diagram is formed through the accurate sample data, and the problems that the number of sampling points is too large, as a result, power consumption of the indicator is too high, and the service life of the indicator is affected are avoided.

Description

technical field [0001] The invention relates to the field of oil well measurement, in particular to a method for automatically switching the sampling rate of a dynamometer. Background technique [0002] Oil pumping is one of the most important processes in oil production. The timely and accurate information on the operation status of oil wells can be used to inspect the production of oil wells per unit time, track and grasp the dynamic situation of underground oil reservoir blocks, predict and evaluate the development potential of oil well blocks, overall analyze and grasp the overall production capacity, and reasonably formulate oilfield production plans. [0003] Oil well dynamometer diagram is an important indicator of the operating status of the oil well, which can fully reflect the operating status of the downhole pump and the exploitation of crude oil. The indicator diagram is used to reflect the working condition of the deep well pump. It can be measured by special i...

Claims


Application Information

Patent Timeline
Patent Type & Authority Applications(China)
IPC IPC(8): E21B47/009
Inventor 唐智斌张俊辉牛传贝
Owner 北京必创科技股份有限公司
Why Eureka
Try Eureka