Test method for welding CCT (continuous cooling transformation) diagram of resistance type thermal simulation test machine

A test method and thermal simulation technology, which is applied in the field of physical simulation test, can solve the problems of low proximity, the test process does not consider the change of heating speed, and it is difficult to accurately find out the phase transition point, so as to achieve the effect of accurate phase transition point

Inactive Publication Date: 2014-10-29
武钢集团有限公司
View PDF4 Cites 2 Cited by
  • Summary
  • Abstract
  • Description
  • Claims
  • Application Information

AI Technical Summary

Problems solved by technology

The test process does not consider the change of heating speed, the actual welding heat cycle process and the problem of temperature overshoot, and the closeness to the actual welding heat cycle process is low, so it is difficult to accurately find out the phase transition point

Method used


Image

  • Test method for welding CCT (continuous cooling transformation) diagram of resistance type thermal simulation test machine
  • Test method for welding CCT (continuous cooling transformation) diagram of resistance type thermal simulation test machine
  • Test method for welding CCT (continuous cooling transformation) diagram of resistance type thermal simulation test machine

Examples


Embodiment 1

[0036] A test method for welding CCT chart of a resistance thermal simulation testing machine, the steps of which are as follows:

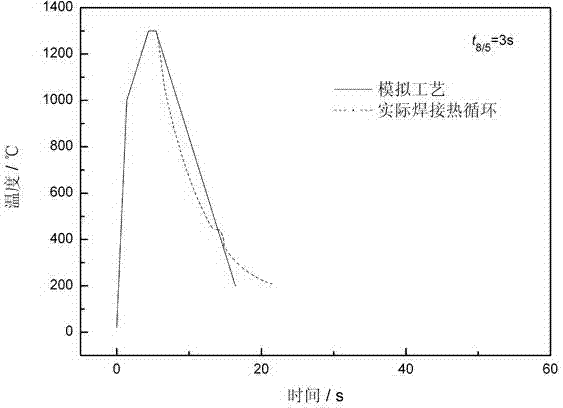
[0037] 1) Heat the thermal simulation sample from room temperature to the peak temperature Tp 1300°C, cooling time t 8 / 5 If it is set to 3s, the heating rate is set to 700°C / s;

[0038] Since the heating speed is set to be greater than 200°C / s, therefore:

[0039] When heating from room temperature to 1000°C, heat according to the set heating rate of 700°C / s, and then heat to the peak temperature Tp1300°C according to the heating rate of 100°C / s;

[0040] 2) After heating, stay for 1 second;

[0041] 3) Since the cooling time is set to t 8 / 5 =3s, so it is directly cooled from 1300°C to room temperature at a rate of 100°C / s;

[0042] 4) According to the tangent method, the phase transition temperature accurately found on the thermal expansion curve starts at 460°C and ends at 310°C.

[0043] The comparison between the above simulation proces...

Embodiment 2

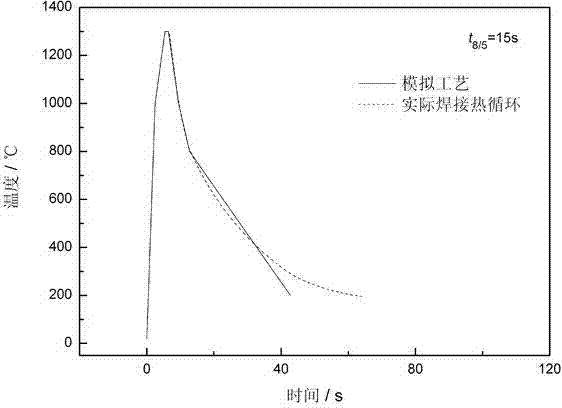
[0045] 1) Heat the thermal simulation sample from room temperature to the peak temperature Tp1300℃, cooling time t 8 / 5 When 15s is selected, the heating rate is set to 400°C / s;

[0046] Since the heating rate is set to be greater than 200°C / s, therefore:

[0047] When heating from room temperature to 1000°C, heat according to the set heating rate of 400°C / s, and then heat to the peak temperature Tp1300°C according to the heating rate of 100°C / s;

[0048] 2) After heating, stay for 1 second;

[0049] 3) Linearly cool the sample in three stages:

[0050] A. Division of stages: cooling from peak temperature Tp1300°C to 1000°C is the first cooling stage; cooling from 1000°C to 800°C is the second cooling stage; cooling from 800°C to room temperature is the third cooling stage;

[0051] B. The cooling rate of each cooling stage is determined according to the following cooling time: cooling rate ν 1 Indicates the first cooling rate, ν 2 Indicates the second cooling rate, ν 3 In...

Embodiment 3

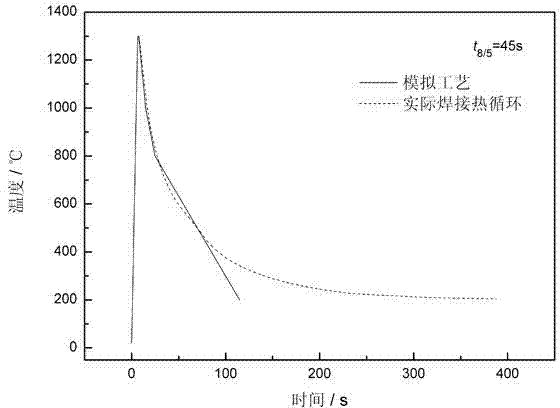
[0056] 1) Heat the thermal simulation sample from room temperature to the peak temperature Tp1300℃, cooling time t 8 / 5 If it is set to 45s, then the heating rate is set to 200°C / s, that is, the sample is directly heated to the peak temperature Tp1300°C at a heating rate of 200°C / s;

[0057] 2) After heating, stay for 1 second;

[0058] 3) Linearly cool the sample in three stages:

[0059] A. Division of stages: cooling from peak temperature Tp1300°C to 1000°C is the first cooling stage; cooling from 1000°C to 800°C is the second cooling stage; cooling from 800°C to room temperature is the third cooling stage;

[0060] B. The cooling rate of each cooling stage is determined according to the following cooling time: cooling rate ν 1 Indicates the first cooling rate, ν 2 Indicates the second cooling rate, ν 3 Indicates the third cooling rate;

[0061] due to cooldown t 8 / 5 Set to 45s, ν 1 then cooling at 40°C / s, ν 2 Cooling at 20°C / s; ν 3 Cool to room temperature accord...


PUM


Abstract

Disclosed is a test method for a welding CCT diagram of a resistance type thermal simulation test machine. The test method includes the steps of heating a thermal simulation sample from the room temperature to the peak temperature Tp; staying for one second; subjecting the sample to linear cooling in three stages, wherein the first cooling stage is the cooling from the peak temperature Tp to 1000 DEG C, the second cooling stage is the cooling from 1000 DEG C to 800 DEG C, and the third cooling stage is the cooling from 800 DEG C to the room temperature; accurately identifying the start and end points of the phase transition on a thermal expansion curve according to a tangent method. The test method for the welding CCT diagram of the resistance type thermal simulation test machine takes the problems of heating rate, multi-stage linear cooling and temperature overshoot into overall consideration, so that the tested welding CCT diagram is close to the actual welding thermal cycle, and the measured phase transition points are accurate. The test method is applicable to the test of the welding of CCT on all resistance type thermal simulation test machines.

Description

technical field [0001] The invention relates to a physical simulation test method, in particular to a test method for welding CCT charts of a resistance thermal simulation test machine. Background technique [0002] Welding CCT chart is an important technical data in the field of welding. It can be used to indirectly evaluate the weldability of steel and reasonably determine the welding procedure specification. It has important practical value and guiding significance in welding production and welding research. [0003] At present, there is no unified standard for welding CCT map testing. Some of the existing testing processes directly use the welding thermal cycle model provided by the equipment itself to test. Although this process is relatively close to actual welding, it is a nonlinear cooling during cooling, and the phase transition point cannot be accurately found by the tangent method; some Although linear cooling is used, most of them use one-stage cooling, which ca...

Claims


Application Information

Patent Timeline
Patent Type & Authority Applications(China)
IPC IPC(8): G09B25/02G01N25/20
Inventor 刘文艳黄治军王辉袁桂莲郑江鹏高俊牟文广曾彤王靓
Owner 武钢集团有限公司
Why Eureka
Try Eureka