Correction method for blood glucose level of blood sample
A calibration method and blood sample technology, applied in the field of blood glucose value calibration, can solve the problems of time-consuming preparation process and detection process, insufficient patient accuracy, etc., and achieve the effect of high accuracy and eliminating the need for devices
- Summary
- Abstract
- Description
- Claims
- Application Information
AI Technical Summary
Problems solved by technology
Method used
Image
Examples
experiment example 1
[0076] Experimental example 1: Obtain the linear relationship between the hematocrit index and the hematocrit
[0077]Prepare the same batch of blood glucose test strips and blood samples from the same blood specimen, adjust the blood glucose concentration of the blood samples to 175mg / dL, and process three groups of blood glucose test strips with hematocrit (%) of 9%, 42% and 71% respectively. Blood samples are tested.
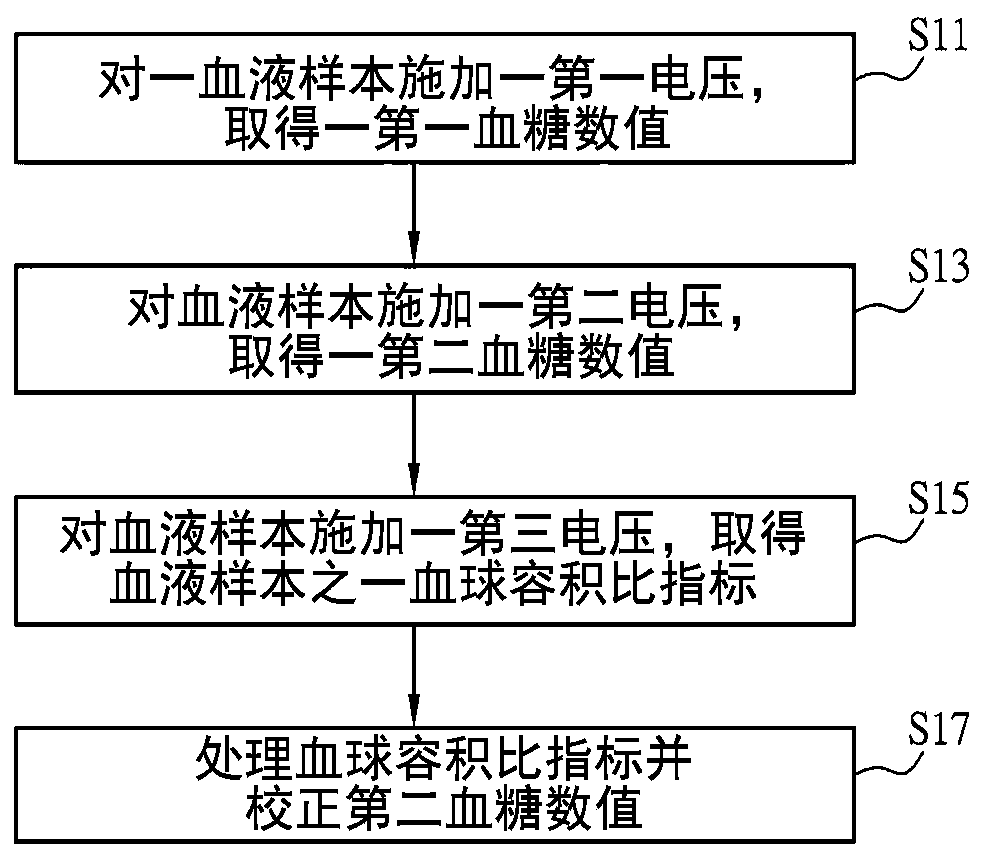
[0078] The above-mentioned three groups of blood samples whose hematocrit (%) were 9%, 42% and 71% were processed with two experimental conditions, one of which was only processed by a high-voltage section to measure the hematocrit index (code name: Group A), and the other group was treated with the calibration method of the present invention (code name: Group B), and the instrument used was DELBiometer or CHInstrument potentiostat. Specifically, in group A, at room temperature (25±2°C, RH=60±5%), DELBio test strips were applied to blood samples with various...
experiment example 2
[0080] Experimental example 2: Linear regression distribution relationship of hematocrit ratio index at different glucose concentrations
[0081] Prepare the same batch of blood glucose test strips and blood samples from the same blood sample, adjust the blood glucose concentration of the blood sample to 175mg / dL, and process five groups of glucose concentrations of 50, 175, 300, 470 and 600 (mg / dL) ) blood samples for testing.
[0082] The above five groups of blood samples with glucose concentrations of 50, 175, 300, 470 and 600 (mg / dL) were processed under two experimental conditions (ie, the voltage application conditions of the above-mentioned groups A and B). Depend on Figure 4 It can be seen that the hematocrit index obtained in group B is less affected by the glucose concentration than that in group A, that is, the hematocrit index obtained in group B is affected by the blood glucose concentration in the glucose concentration range of 40-600mg / dL small. In addition...
experiment example 3
[0083] Experimental Example 3: Using the hematocrit ratio to feed back the deviation ratio before and after the blood glucose level
[0084] Prepare the same batch of blood glucose test strips and blood samples from the same blood specimen, adjust the blood glucose concentration of the blood samples to 175mg / dL, and process three groups of blood glucose test strips with hematocrit (%) of 9%, 42% and 71% respectively. Blood samples are tested.
[0085] The above five groups of blood samples with hematocrit (%) of 9%, 42% and 71% were processed under three experimental conditions (ie no feedback group, feedback group A and feedback group B). Among them, the non-feedback group is the blood glucose value obtained by applying a first voltage to blood samples with different hematocrits (9%, 42% and 71%) on the DELBio test strip at room temperature. In group A with feedback, at room temperature (25±2°C, RH=60±5%), a DELBio test strip was applied to blood samples of various hematocri...
PUM
 Abstract
Description
Claims
Application Information
 - R&D
- Intellectual Property
- Life Sciences
- Materials
- Tech Scout
- Unparalleled Data Quality
- Higher Quality Content
- 60% Fewer Hallucinations
Browse by: Latest US Patents, China's latest patents, Technical Efficacy Thesaurus, Application Domain, Technology Topic, Popular Technical Reports.
© 2025 PatSnap. All rights reserved.Legal|Privacy policy|Modern Slavery Act Transparency Statement|Sitemap|About US| Contact US: help@patsnap.com


