Graphical temperature recording method and graphical temperature recording device
A technology of temperature recording and graphics, applied to thermometers, measuring devices, parts of thermometers, etc., can solve problems such as poor visibility, poor intuition, and complicated processes, and achieve simple structure, strong traceability, and operability strong effect
- Summary
- Abstract
- Description
- Claims
- Application Information
AI Technical Summary
Problems solved by technology
Method used
Image

Examples
Embodiment 1
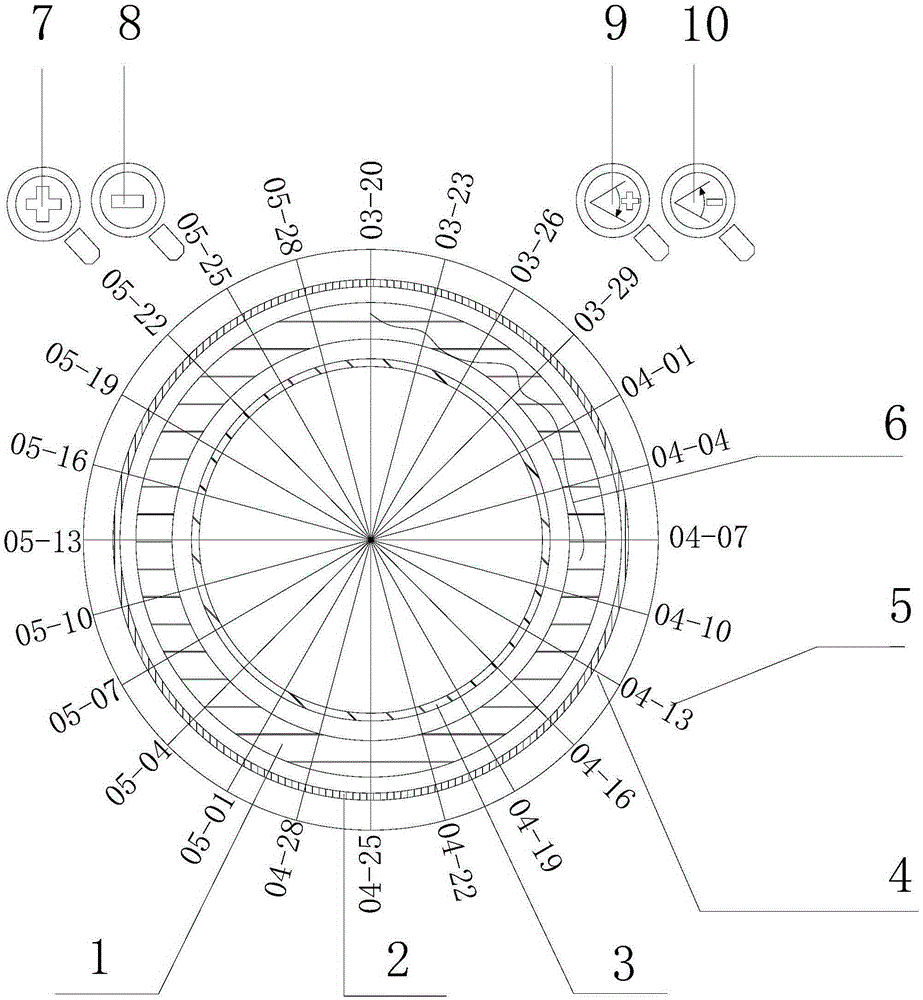
[0042] attached figure 1 It is a schematic diagram of the result of the graphical display of data in the present invention. Among them, ring 1 represents the set temperature zone, ring 2 is the low-temperature alarm zone, and ring 3 is the high-temperature alarm line. Click the corresponding ring to display the temperature setting value of the corresponding sub-temperature zone.
[0043] as attached figure 1 As shown, ray 4 represents the time scale line, and there are 24 same time scale lines; the angle between adjacent time scale lines is 15 degrees, representing a fixed time interval, which is 72 hours by default; zoom in In the state or in the zoomed out state, the time interval decreases or increases accordingly; except for certain cases (angle free scaling), the time at the starting point, that is, the time corresponding to the 12 o’clock direction timeline remains unchanged, and this time is the starting temperature record time, i.e. figure 2 The date 03-20 shown in...
Embodiment 2
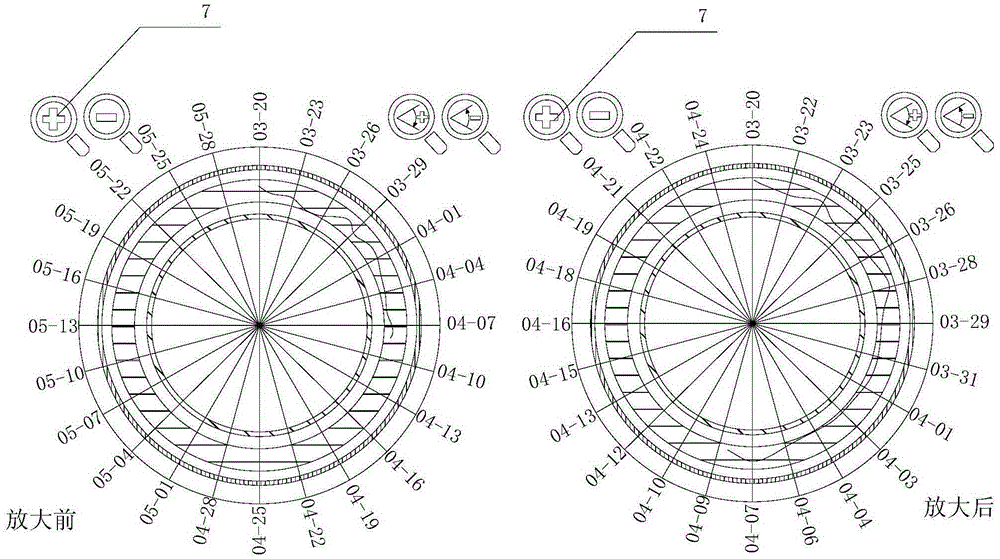
[0048] This embodiment provides a method for enlarging and querying the temperature data in Embodiment 1 with a fixed angle ratio. figure 2 for the related diagram. attached figure 2 The button 7 in is an angle scaling button. After clicking this button, the start time remains unchanged, and the time interval represented by adjacent time scale lines decreases. Such as figure 2 As shown, before zooming in, the time interval is 72 hours, that is, the time interval represented by each 15-degree angle area is 72 hours; the default zoom ratio of the system is 2, and after clicking button 7 to zoom in, the time interval represented by each 30-degree angle area The time interval is 72 hours, that is, the time interval represented by each 15-degree angle area becomes 1 / 2 of the original.
[0049] Press and hold the 7 button for 3 seconds, and the window for modifying the magnification ratio will pop up, and the magnification ratio value can be modified. The modification range is...
Embodiment 3
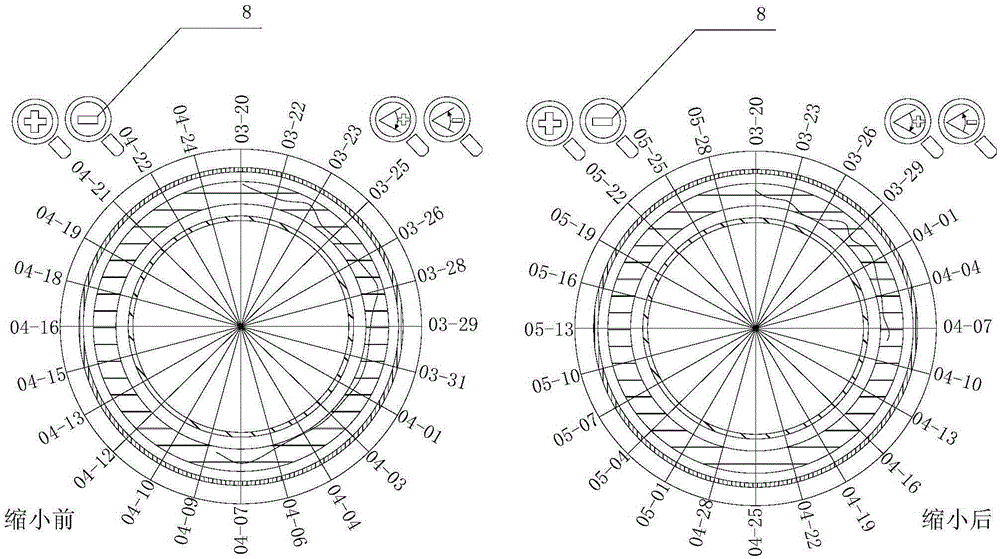
[0051] This embodiment provides the temperature data in embodiment 1 to carry out the method that the angle fixed ratio reduces query, appended image 3 for the related diagram. attached image 3 The button 8 in is the button for scaling down the angle. After clicking this button, the start time remains unchanged, and the time interval represented by the adjacent time scale lines increases. Such as Figure 4 As shown, before zooming out, the time interval is 7, and the time interval represented by each two 15-degree angle areas is 72 hours; the default reduction ratio of the system is 0.5. After clicking button 8 to zoom out, the time interval represented by each 15-degree angle area The total time is 72 hours, that is, the time interval represented by each 15-degree angle area becomes twice the original.
[0052] By pressing and holding the 8 button for 3 seconds, the window for modifying the reduction ratio value will pop up, and the reduction ratio value can be modified,...
PUM
 Abstract
Description
Claims
Application Information
 - R&D
- Intellectual Property
- Life Sciences
- Materials
- Tech Scout
- Unparalleled Data Quality
- Higher Quality Content
- 60% Fewer Hallucinations
Browse by: Latest US Patents, China's latest patents, Technical Efficacy Thesaurus, Application Domain, Technology Topic, Popular Technical Reports.
© 2025 PatSnap. All rights reserved.Legal|Privacy policy|Modern Slavery Act Transparency Statement|Sitemap|About US| Contact US: help@patsnap.com