Initial sketch based stomach CT (Computed Tomography) image lymph node detection system
A technology for CT images and lymph nodes, applied in the field of image processing, can solve the problems of high false alarm rate of lymph nodes, long use time, and inaccurate location of lymph node boundaries, so as to achieve accurate extraction, improve processing speed, and reduce false alarm rate.
- Summary
- Abstract
- Description
- Claims
- Application Information
AI Technical Summary
Problems solved by technology
Method used
Image

Examples
Embodiment Construction
[0045] The technical scheme of the present invention and effect are described in detail below in conjunction with accompanying drawing:
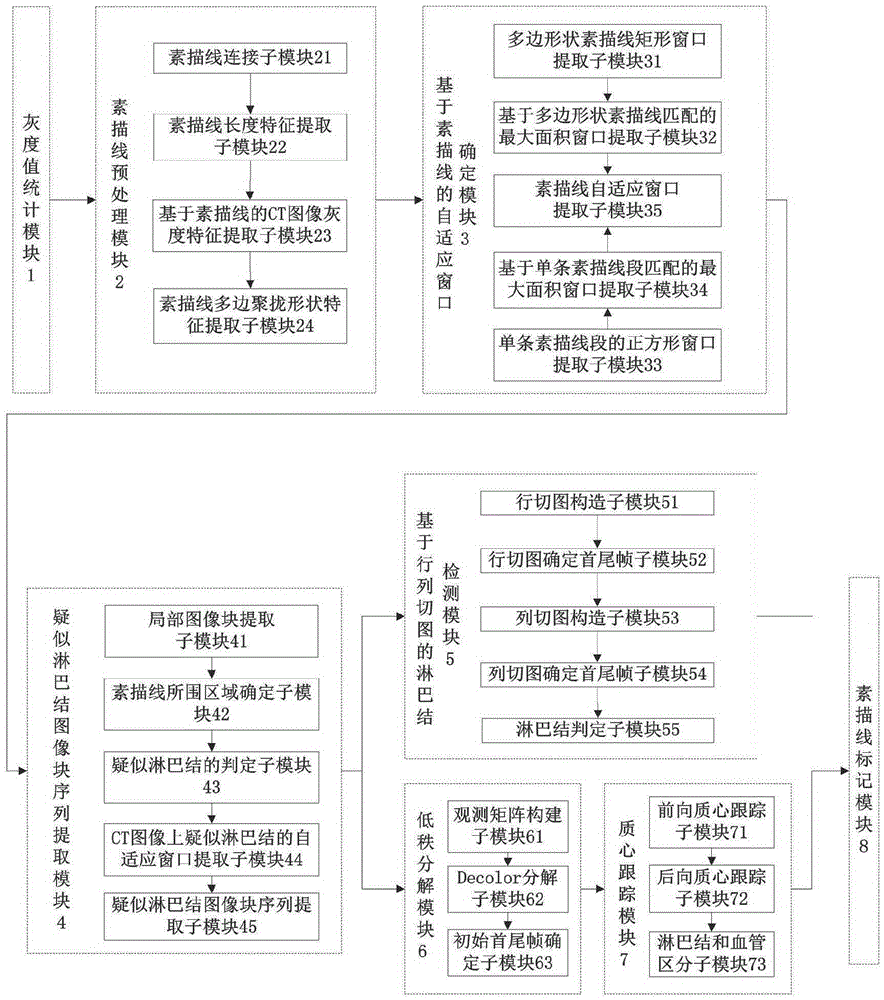
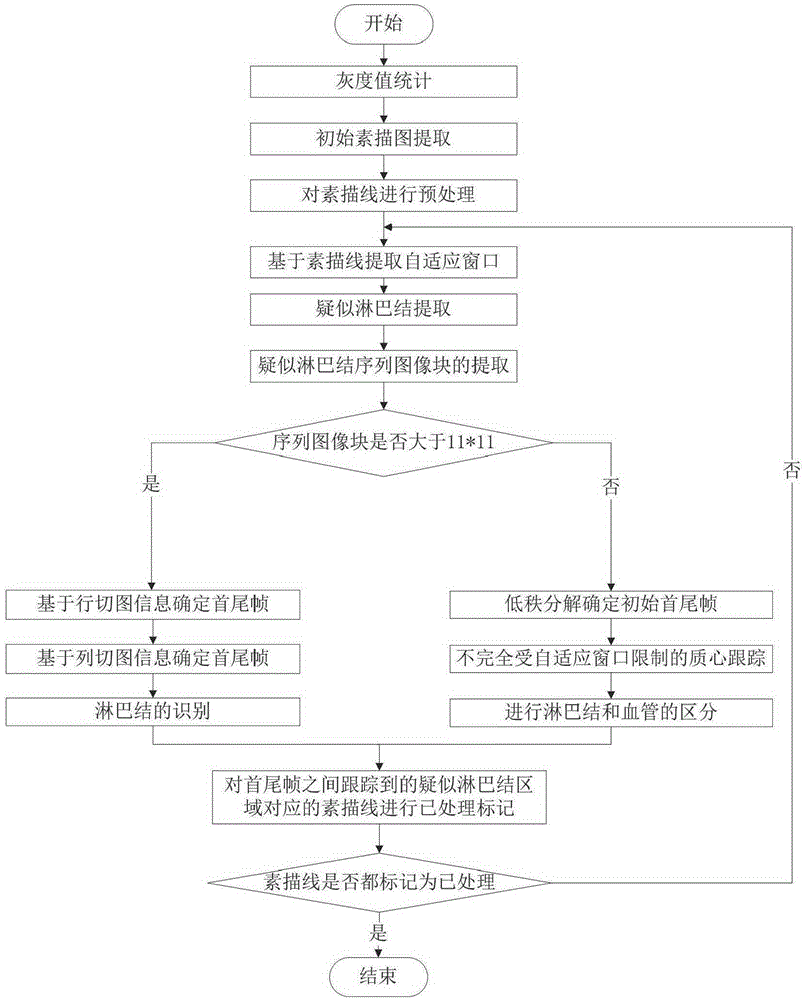
[0046] refer to figure 1 , the detection system of the present invention includes: a gray value statistics module 1, a sketch line preprocessing module 2, an adaptive window determination module 3 based on the sketch line, a suspected lymph node image block sequence extraction module 4, and a lymph node detection based on row and column cut images Module 5, Low Rank Decomposition Module 6, Centroid Tracking Module 7, Sketch Line Labeling Module 8. in:
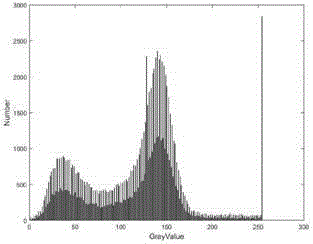
[0047] The gray value statistical module 1 is used to divide each pair of CT images in the original CT sequence diagram into four categories by the otsu classification algorithm, and count the gray value range of each class respectively, according to the gray value from small to The largest order is the gray value range of the background, the gray value range of the fat, the gray value rang...
PUM
| Property | Measurement | Unit |
|---|---|---|
| Angle | aaaaa | aaaaa |
Abstract
Description
Claims
Application Information
PatSnap Eureka turns technology decisions into work you can execute. Powered by our Innovation Knowledge Graph, it runs expert workflows across engineering, life sciences, materials and intellectual property. Get your review-ready output in minutes.


