Determining method of light compensation utilization of phalaris arundinacea in reed and phalaris arundinacea community
A determination method and a technology for thorn grass, applied in the field of efficient utilization of light resources in the vertical distribution of plants
- Summary
- Abstract
- Description
- Claims
- Application Information
AI Technical Summary
Problems solved by technology
Method used
Image

Examples
Embodiment 1
[0020] On May 5, 2015, the weather was fine, and the reed grass community was selected. The sample area was 1m×1m, the height of the reed was about 2.0m, and the density was 25 plants / m 2 , the height of the grass is about 1.5m. Follow the steps below to determine the method of light compensation utilization of phragmites in Phragmites bulrushes community.
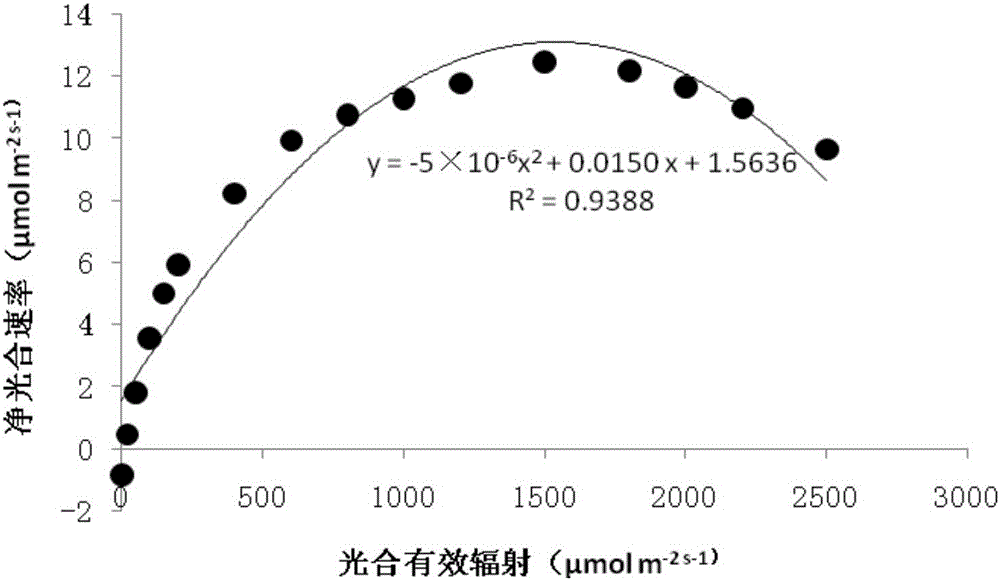
[0021] (1) Use the LI-6400 portable photosynthetic instrument produced by LI-COR Company of the United States to measure the middle part of the third expanded leaf below the top. Using the artificial light source configured by the instrument, the time is 8:00, 10:00, 12:00, 14:00, 16:00, and the light intensity gradient is 0, 20, 50, 100, 150, 200, 400, 600, 800 , 1000, 1200, 1500, 1800, 2000, 2200, 2500μmolm -2 the s -1 , the system automatically records the net photosynthetic rate corresponding to different light intensities every 3 minutes to fit the light response curve. According to the coefficient of determinatio...
Embodiment 2
[0030] On May 5, 2015, the weather was fine, and the reed grass community was selected. The sample area was 1m×1m, the height of the reed was about 2.0 meters, and the density was 45 plants / m 2 , the height of the grass is about 1.5m. Follow the steps below to determine the method of light compensation utilization of phragmites in Phragmites bulrushes community.
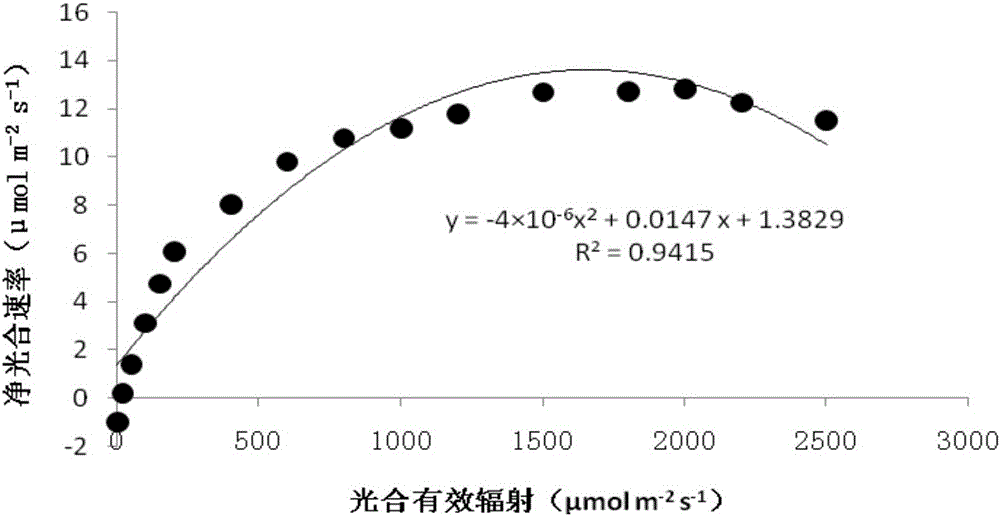
[0031] (1) Use the LI-6400 portable photosynthetic instrument produced by LI-COR Company of the United States to measure the middle part of the third expanded leaf below the top. Using the artificial light source configured by the instrument, the time is 8:00, 10:00, 12:00, 14:00, 16:00, and the light intensity gradient is 0, 20, 50, 100, 150, 200, 400, 600, 800 , 1000, 1200, 1500, 1800, 2000, 2200, 2500μmolm -2 the s -1 , the system automatically records the net photosynthetic rate corresponding to different light intensities every 3 minutes to fit the light response curve. According to the coefficient of determ...
PUM
| Property | Measurement | Unit |
|---|---|---|
| Height | aaaaa | aaaaa |
| Height | aaaaa | aaaaa |
Abstract
Description
Claims
Application Information
 - R&D
- Intellectual Property
- Life Sciences
- Materials
- Tech Scout
- Unparalleled Data Quality
- Higher Quality Content
- 60% Fewer Hallucinations
Browse by: Latest US Patents, China's latest patents, Technical Efficacy Thesaurus, Application Domain, Technology Topic, Popular Technical Reports.
© 2025 PatSnap. All rights reserved.Legal|Privacy policy|Modern Slavery Act Transparency Statement|Sitemap|About US| Contact US: help@patsnap.com