

Optimum weighted composite prediction method for shipment amount of manufacturing industry
A technology of weighted combination and forecasting method, applied in forecasting, manufacturing computing system, data processing application, etc., can solve the problem of low forecasting accuracy of shipment forecasting model, and achieve the effect of clear thinking, high practicability and simple calculation
- Summary
- Abstract
- Description
- Claims
- Application Information
AI Technical Summary
Problems solved by technology
Method used
Image

Examples
Embodiment 1
[0041] Such as Figure 1-3 shown.
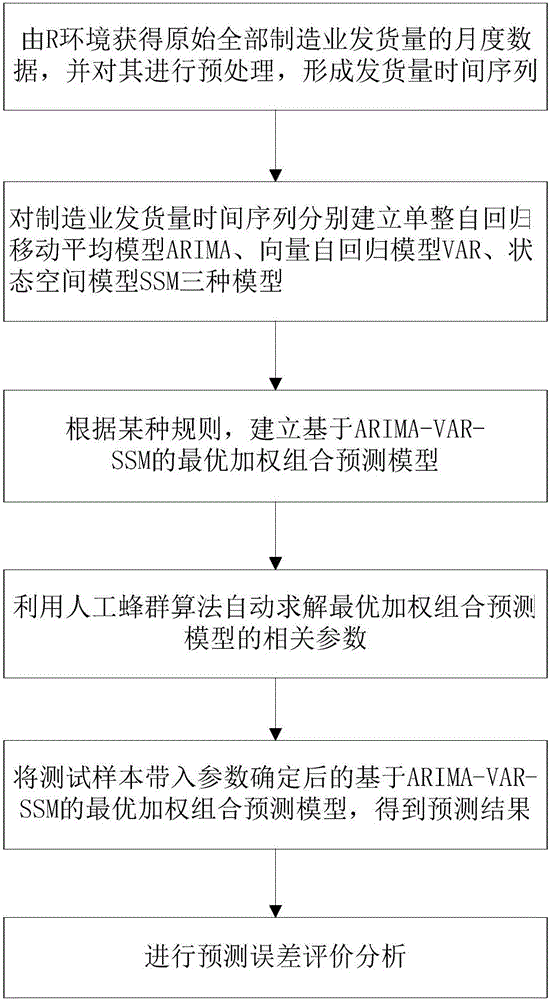
[0042] An optimal weighted combined forecasting method for manufacturing shipments, comprising the following steps:
[0043] S1: Obtain the original monthly data of all manufacturing shipments from the R environment, and divide it into a training set and a test set to form a time series of shipments:
[0044] Obtain the monthly data of all manufacturing shipments from February 1992 to June 2015 from the website of the US Department of Commerce, and divide it into a training set and a test set. The training set data is from February 1992 to March 2015 , the test set data is from April 2015 to June 2015;
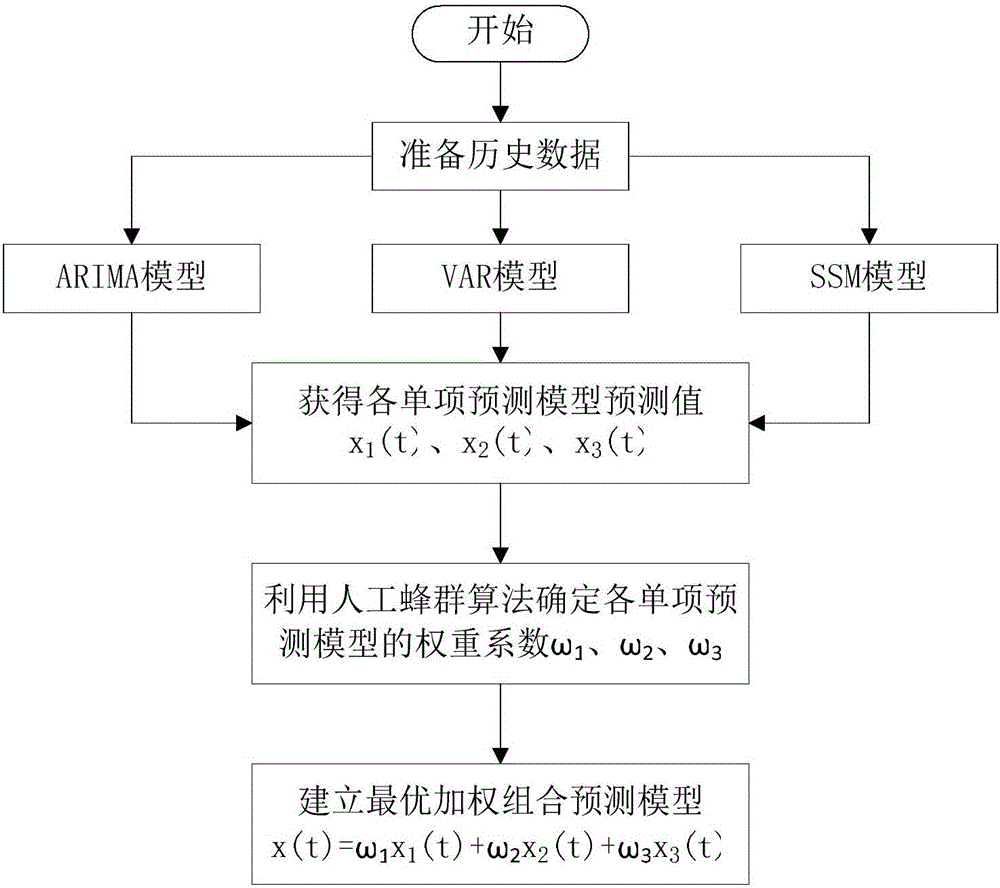
[0045] S2: Establish the integrated autoregressive moving average model ARIMA (AutoregressiveIntegrated Moving Average Model), vector autoregressive model VAR (Vecotr Atuo-regression Model) and state space model SSM (State Space Model) respectively for the time series of shipments, and respectively To perform predictive analysis:
[0046...
Embodiment 2
[0060] The optimal weighted combination forecasting method for manufacturing shipments as described in Example 1, the difference is that the specific method of the cointegration test in the step S2 is Engle-Granger cointegration test; the criterion for determining the lag period is : The optimal lag period is determined by the SIC and AIC information criteria.
Embodiment 3
[0062] The optimal weighted combined forecasting method for manufacturing shipments as described in Example 1, the difference is that the rule for establishing the optimal weighted combined forecasting model based on ARIMA-VAR-SSM in the step S3 is, e t has the smallest absolute value.
PUM
 Abstract
Description
Claims
Application Information