Weighted Voronoi diagram generation method used for big data test

A technology of big data and data points, applied in the field of weighted Voronoi diagram generation, can solve problems such as unacceptable complexity, achieve uniform distribution, ensure accuracy, and ensure fairness

Active Publication Date: 2016-10-12
SHANDONG UNIV
View PDF4 Cites 7 Cited by
  • Summary
  • Abstract
  • Description
  • Claims
  • Application Information

AI Technical Summary

Problems solved by technology

For a huge data, this complexity is obviously unacceptable

Method used


Image

  • Weighted Voronoi diagram generation method used for big data test
  • Weighted Voronoi diagram generation method used for big data test
  • Weighted Voronoi diagram generation method used for big data test

Examples


Embodiment Construction

[0049] The present invention will be further described below in conjunction with the accompanying drawings and embodiments.

[0050] A method for generating a weighted Voronoi diagram for big data testing, comprising the following steps:

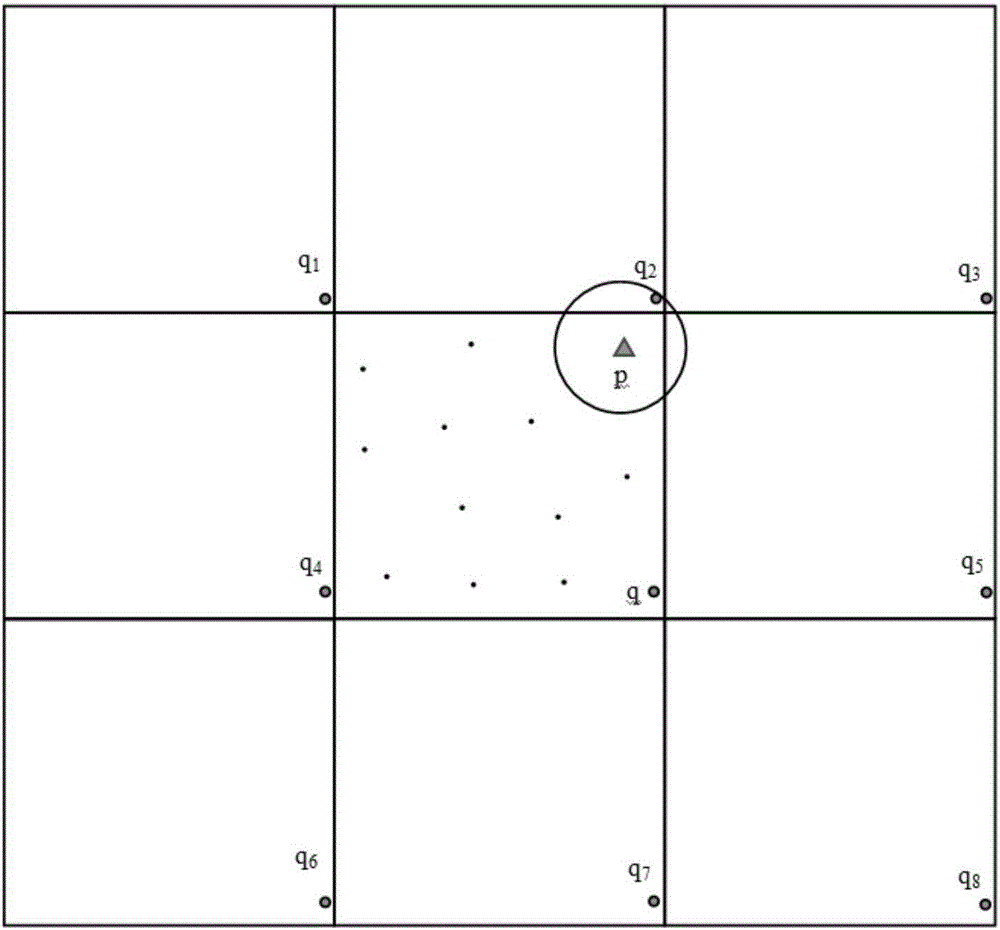
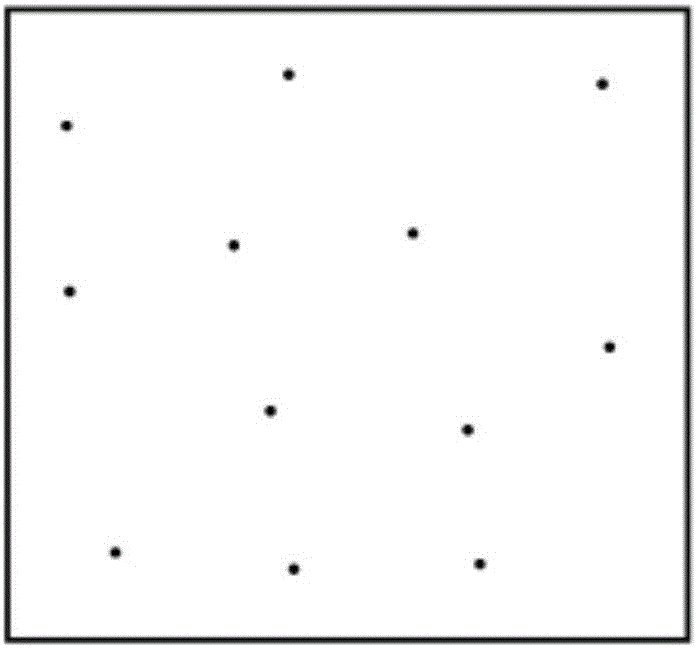
[0051] (1) Construct a group of randomly evenly distributed points as sites in a certain area, and ensure that the shortest distance between sites is not less than 2r, where r is a preset constant. The Voronoi diagram for this collection of sites is then computed.

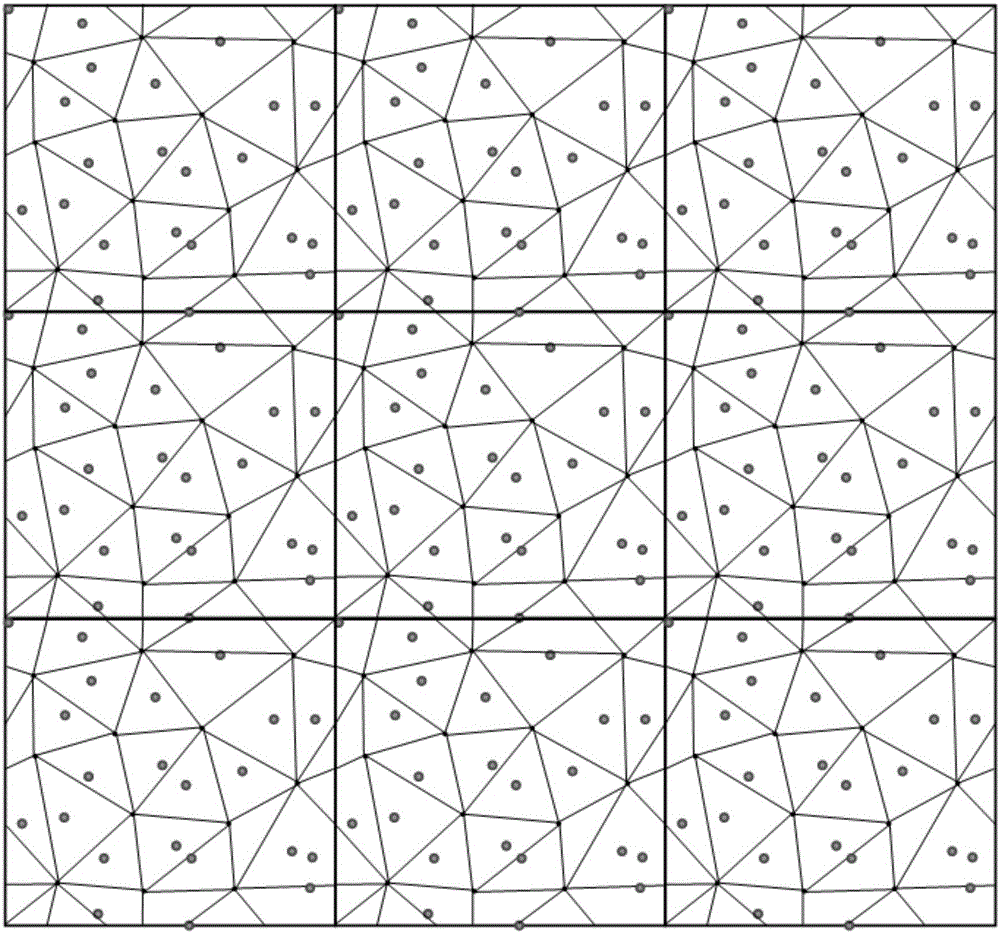
[0052] (2) According to the result of calculating the Voronoi diagram above, construct and calculate the Voronoi diagram of the large-scale data point set.

[0053] (3) According to the result obtained from the above calculation of the Voronoi diagram of the large data point set, the weighted Voronoi diagram of the large data is constructed based on the agreed weight set W.

[0054]Described step (1) comprises the steps:

[0055] (1.1) Construct a random path that can traverse...


PUM


Abstract

The invention discloses a weighted Voronoi diagram generation method used for a big data test. The method comprises the following steps of constructing a group of randomly and uniformly distributed points in a set region as sites, ensuring a shortest distance between the two sites not to be smaller than a set threshold, and calculating a Voronoi diagram of a set consisting of all the sites; constructing a large-scale data point set in the set region according to the Voronoi diagram of the site set, traversing all Voronoi points, and connecting the Voronoi points to form a Voronoi diagram of the large-scale data point set; randomly selecting any site, modifying all Voronoi edges around the selected site according to a weighted distance function between the sites, and constructing a weighted Voronoi diagram based on an appointed weight set W; and applying the generated weighted Voronoi diagram to the big data test. According to the method, the overall site distribution has randomness and the distribution is relatively uniform, so that the correctness during the big data test is ensured.

Description

technical field [0001] The invention relates to a method for generating a weighted Voronoi diagram for large data testing. Background technique [0002] As a spatial subdivision method, clustering method and common geometric data structure, Voronoi diagram has a wide range of applications in virtual reality, robotics, geographic information systems, wireless sensors, biological computing, data processing and other fields. Voronoi diagrams often play the role of basic data structures in the design of many classic computational geometry algorithms such as visibility calculations, path planning, nearest neighbor queries, and lighting calculations. Given a set of discrete points (we call each point a site), divide all points in a given space according to the nearest neighbor attribute, and the set of all points closest to a site is called the site’s A Voronoi region, the Voronoi diagram of all Voronoi regions combined is called the site set. The edges on the boundary of the Vo...

Claims


Application Information

Patent Timeline
Patent Type & Authority Applications(China)
IPC IPC(8): G06T17/20
CPCG06T17/20
Inventor 杨承磊杨力群冯硕王璐刘士军孟祥旭
Owner SHANDONG UNIV
Why Eureka
Try Eureka