Large-scale diagram data representation method
A graph data, large-scale technology, applied in the field of large-scale graph data representation, can solve problems such as low query efficiency, reduce space consumption, improve storage efficiency, and improve efficiency.
- Summary
- Abstract
- Description
- Claims
- Application Information
AI Technical Summary
Problems solved by technology
Method used
Image
Examples
Embodiment Construction
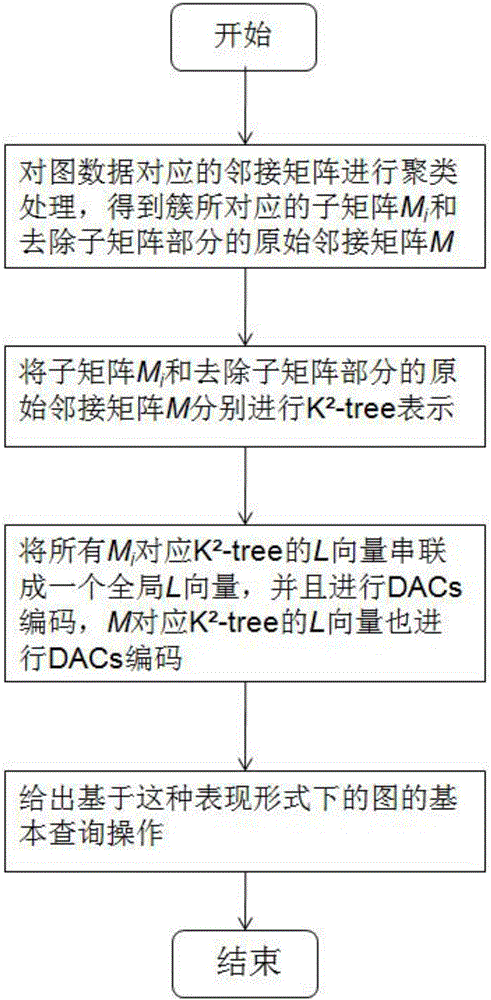
[0050] A large-scale graph data representation method, such as figure 1 shown, including the following steps:
[0051] Step 1. Guided by the idea of density-based clustering, divide the graph data into clusters of different sizes.
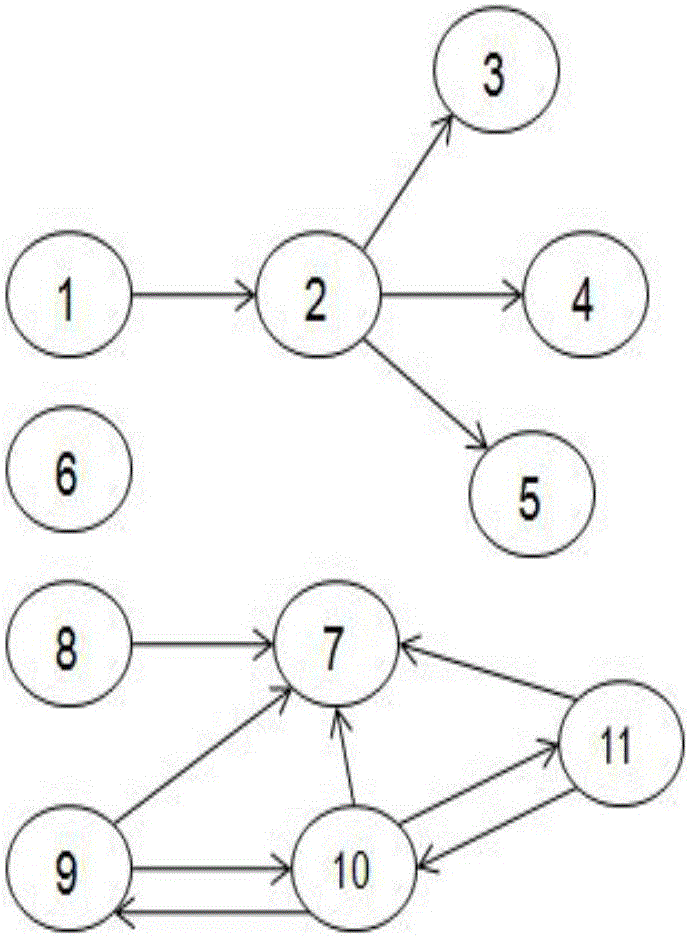
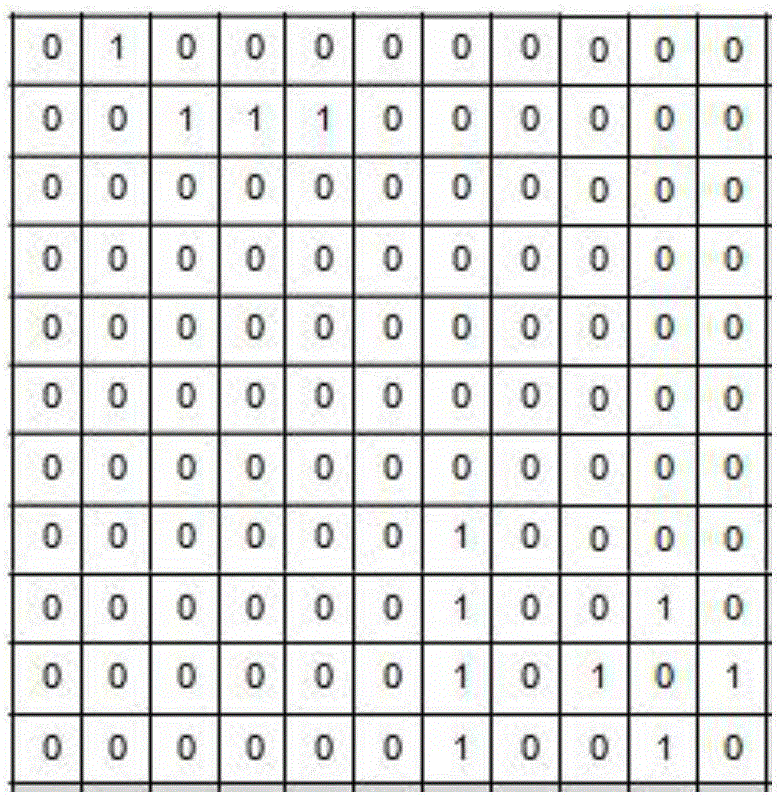
[0052] Step 1.1. Abstract the graph data into an adjacency matrix representation.
[0053] Step 1.2. Use the elements in the first row and first column of the adjacency matrix as the starting point of the sub-matrix, expand the size of the sub-matrix along the main diagonal of the adjacency matrix, and increase the width of the sub-matrix by 1 each time it is expanded.
[0054] In step 1.3, after the expansion of the sub-matrix is completed, the outlier rate φ and the size MinSize of the current sub-matrix are calculated.
[0055] The outlier rate φ of the above sub-matrix is: φ=m1 / m2; among them, m1 indicates that the row number belongs to the current sub-matrix, but the number of elements with a value of 1 whose column number has exceeded t...
PUM
 Abstract
Description
Claims
Application Information
 - R&D
- Intellectual Property
- Life Sciences
- Materials
- Tech Scout
- Unparalleled Data Quality
- Higher Quality Content
- 60% Fewer Hallucinations
Browse by: Latest US Patents, China's latest patents, Technical Efficacy Thesaurus, Application Domain, Technology Topic, Popular Technical Reports.
© 2025 PatSnap. All rights reserved.Legal|Privacy policy|Modern Slavery Act Transparency Statement|Sitemap|About US| Contact US: help@patsnap.com


