Air quality data visualization system

An air quality index and air quality technology, applied in image data processing, structured data retrieval, electronic digital data processing, etc., can solve the problem of not being able to intuitively display user-friendly data.

Inactive Publication Date: 2017-08-11
HEFEI UNIV
View PDF3 Cites 13 Cited by
  • Summary
  • Abstract
  • Description
  • Claims
  • Application Information

AI Technical Summary

Problems solved by technology

However, the current air quality management system does not pay much attention to data visualization, and cannot intuitively display data that is beneficial to users, which is also an urgent problem to be solved

Method used


Image

  • Air quality data visualization system
  • Air quality data visualization system
  • Air quality data visualization system

Examples


Embodiment Construction

[0029] In order to make the objectives, technical solutions and advantages of the present invention clearer, the following further describes the present invention in detail through the accompanying drawings and embodiments. However, it should be understood that the specific embodiments described here are only used to explain the present invention, and are not used to limit the scope of the present invention.

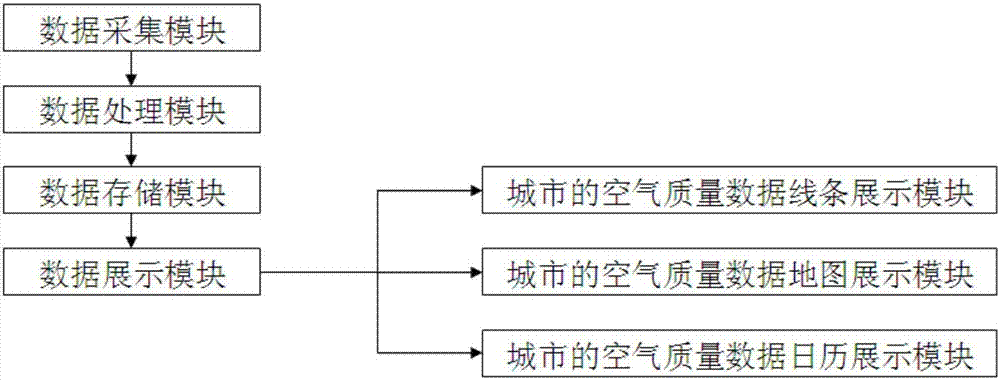
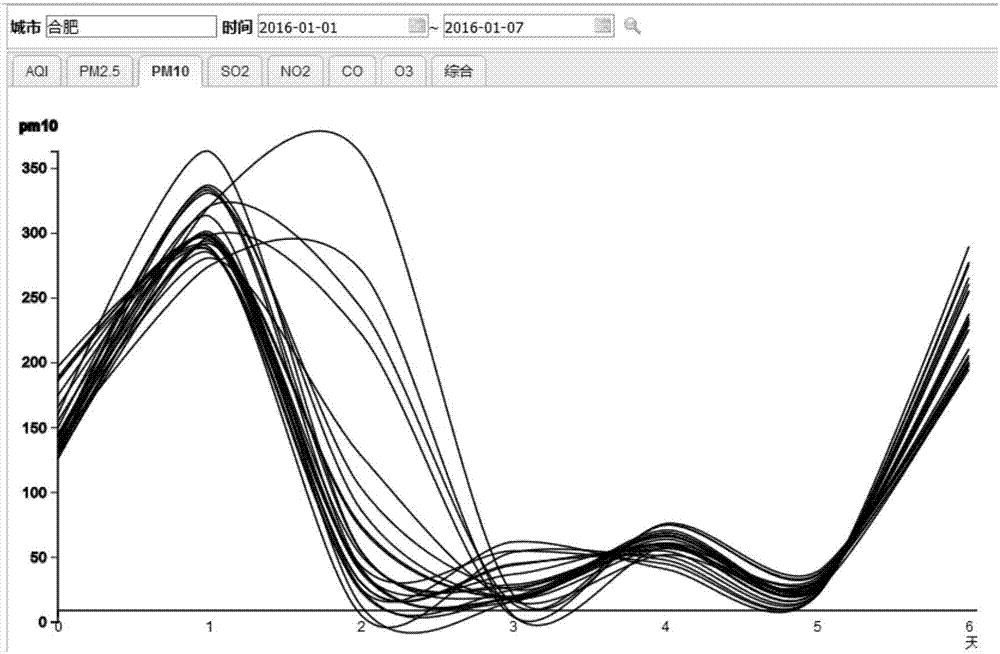
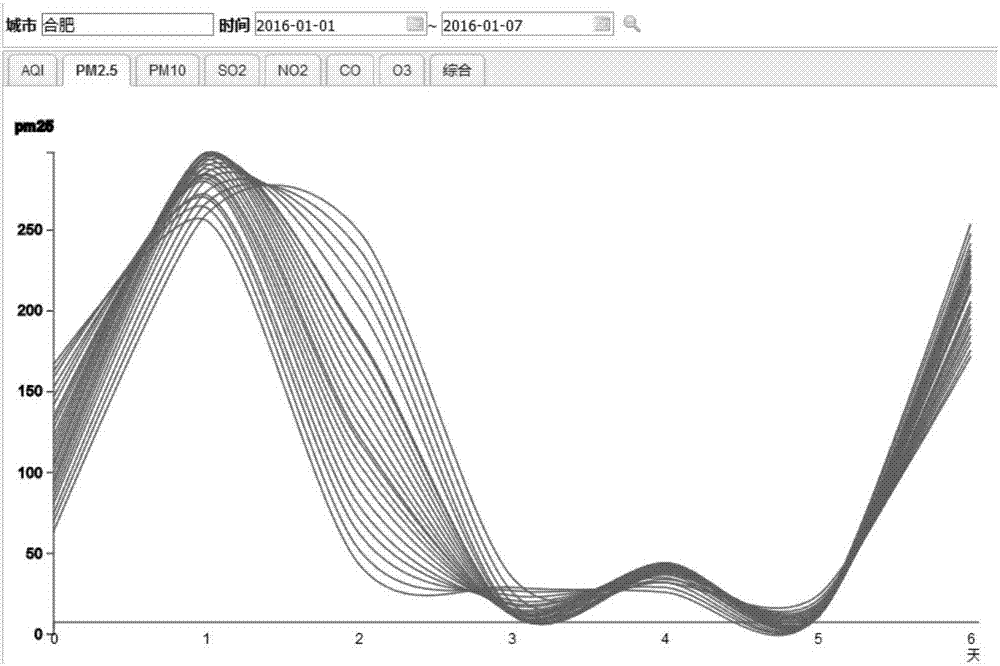
[0030] See figure 1 , The present invention discloses an air quality data visualization system, which includes a data collection module, a data processing module, a data storage module, a city air quality data line display module, a city air quality data map display module and a city air quality data calendar Display module.

[0031] Among them, the data collection module obtains the particulate matter (PM2.5), inhalable particulate matter (PM10), SO2, NO2, O3, and CO of the corresponding air quality pollution degree according to the site and city in real time; see Table 1, f...


PUM


Abstract

The invention discloses an air quality data visualization system, which comprises a data collection module, a data processing module, a data storage module, an urban air quality data line display module, an urban air quality data map display module and an urban air quality data calendar display module. By use of the air quality data visualization system disclosed by the invention, on the basis of information visualization technological means including parallel coordinates, calendar graphs, time series graphs and GIS (Geographic Information System) Baidu maps, processing is carried out, air quality data can be favorably subjected to classification and analysis processing, and a decision support can be provided for administrative departments. On the basis of the air quality data visualization system disclosed by the invention, overproof pollutant analysis can be carried out, and the calendar graph can be compared to obtain the situations of main pollutants and overproof pollutants.

Description

Technical field [0001] The invention relates to an air quality system, in particular to an air quality data visualization system. Background technique [0002] With the continuous improvement of people's living standards, the problem of air pollution has received increasing attention and urgently needs to be solved. How to effectively analyze and process the complex and huge air quality data has become an important issue. From each air quality report, we can see that the air pollution in some areas of our country cannot be ignored. At the same time, from the mobile phone APP market, we can see that there are more and more applications for environmental monitoring, and people’s attention to air quality issues has also increased significantly. . However, the current air quality management system does not pay much attention to data visualization, and cannot intuitively display data that is beneficial to users. This is also a problem that needs to be solved urgently. Summary of th...

Claims


Application Information

Patent Timeline
Patent Type & Authority Applications(China)
IPC IPC(8): G06F17/30G06T11/20
CPCG06F16/248G06F16/252G06F16/29G06T11/203G06T11/206
Inventor 吕刚熊锐汤伟徐超峰
Owner HEFEI UNIV
Why Eureka
Try Eureka