Global climate vector field data visualization method based on VR and gesture interaction technology

A technology of vector field and gesture, applied in the field of data visualization of global climate vector field, can solve the problems of few researches on 3D atmospheric data visualization

Active Publication Date: 2017-09-15
ZHEJIANG UNIV OF TECH
View PDF7 Cites 15 Cited by
  • Summary
  • Abstract
  • Description
  • Claims
  • Application Information

AI Technical Summary

Problems solved by technology

VR has a significant effect on further improving the readability of visualized data. VR is used in a large number of visualization studies. Irene Katsouri, Aimilia Tzanavari, Kyriakos Herakleous, and Charalambos Poullis. 2015. Visualizing and assessing hypotheses for marine archaeology in a VR CAVE environment. ACM J. Comput.Cult.Herit.8,2,Artic

Method used


Image

  • Global climate vector field data visualization method based on VR and gesture interaction technology
  • Global climate vector field data visualization method based on VR and gesture interaction technology
  • Global climate vector field data visualization method based on VR and gesture interaction technology

Examples


Embodiment Construction

[0070] The method for visualizing global climate vector field data based on VR and gesture interaction technology of the present invention will be described in detail below in conjunction with the accompanying drawings.

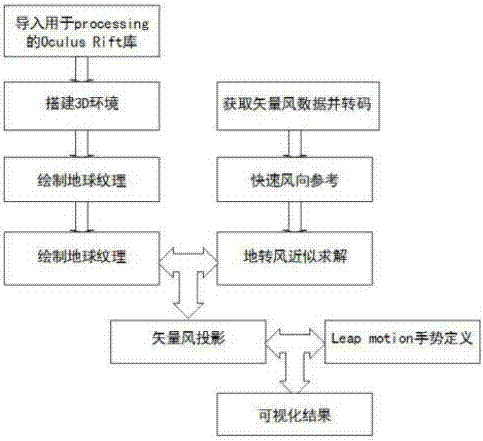
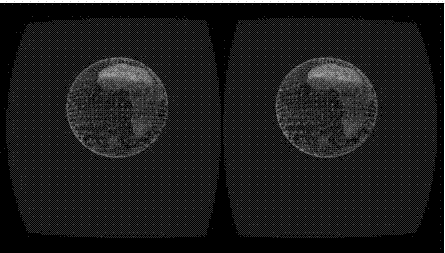
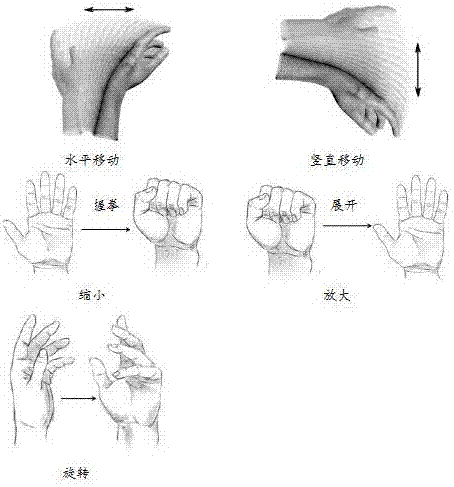
[0071] Such as figure 1 As shown, the global climate vector field data visualization method based on VR and gesture interaction technology of the present invention, its vector field data includes vector wind, ocean current, etc., because the visualization method of ocean current is similar to the vector wind, the following is only implemented for vector wind visualization The process is described. It includes importing the Oculus Rift library in processing, then building a 3D environment, designing a scene including an earth and cosmic background, adding map data obtained from Natural Earth to the designed earth, and then operating from the National Weather Service The Global Forecast System (GFS) uploads and downloads the required vector wind data, decodes ...


PUM


Abstract

The invention discloses a global climate vector field data visualization method based on VR and a gesture interaction technology. The method comprises the steps that a 3D environment is set up, and a scene containing an earth and a cosmic background is designed; map data acquired from the Natural Earth is added to the designed earth, and then weather data is downloaded from a global forecasting system operated by the National Weather Service and is decoded; next, the data is subjected to wind direction quick reference and geostrophic wind approximate solving, vector wind is projected to the designed earth, and finite difference approximation is used for estimating distortion in an interpolation process; and last, interaction demands are designed, and various gestures are defined according to the demands. Through the method, global climate changes are simulated more realistically, the perceptibility and authenticity of a model and the data are enhanced, information details at a higher level are obtained, a user can truly feel a research object standing in front and can operate the research object through gestures, and therefore a visual spatial data visualization analysis environment is constructed.

Description

technical field [0001] The invention relates to the technical field of computer graphics, in particular to a global climate vector field data visualization method based on VR and gesture interaction technology. Background technique [0002] The visualization method of global climate vector data provides another intuitive and clear expression method for the display of traditional meteorological vector data, and provides a convenient tool for relevant personnel to analyze climate data. [0003] Climate data generally includes vector field data such as wind and ocean currents. For three-dimensional vector field data, traditional vector field visualization methods such as arrow diagrams, flow diagrams, and line integral convolution are generally provided. Iconic methods, geometric methods, and texture methods are commonly used. Wait. For forecasters, it is difficult to gain an understanding of the overall atmospheric situation through these complex graphics and texts. 3D atmos...

Claims


Application Information

Patent Timeline
IPC IPC(8): G06F3/01G06F3/0481G06T17/05
CPCG06F3/017G06F3/04815G06T17/05Y02A90/10
Inventor 卢书芳蔡历王晨高飞
Owner ZHEJIANG UNIV OF TECH
Why Eureka
Try Eureka