Power grid wildfire disaster risk distribution diagram drawing method and system
A distribution map and power grid technology, applied in fire alarms, image data processing, 2D image generation, etc., can solve problems such as line tripping and power outages, unanalyzed power grid mountain fire disaster risk distribution, endangering the safe and stable operation of large power grids, etc. , to achieve the effect of convenient implementation, clear principle and strong practicability
- Summary
- Abstract
- Description
- Claims
- Application Information
AI Technical Summary
Problems solved by technology
Method used
Image
Examples
Embodiment 1
[0032] This embodiment discloses a method for drawing a distribution map of a power grid mountain fire disaster risk, the method comprising:
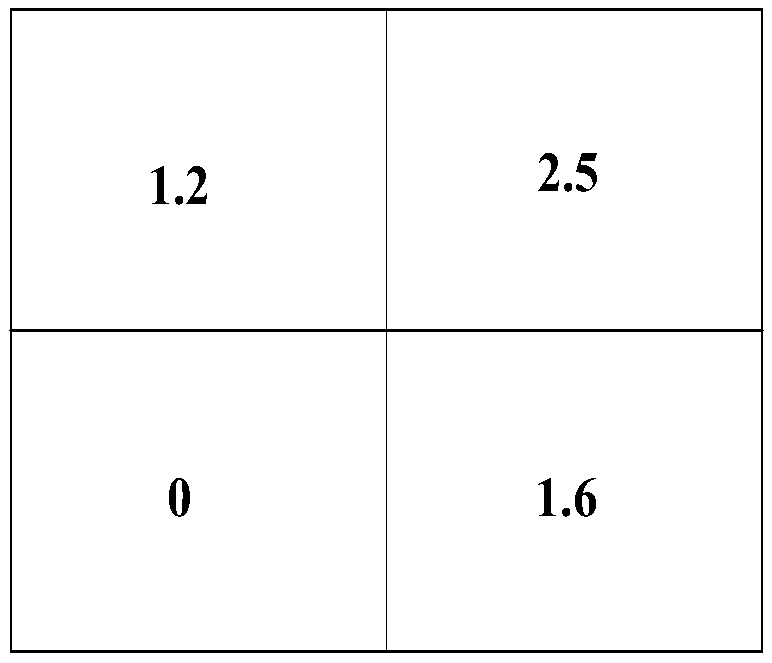
[0033] Step 1. Obtain the prediction result of the power grid wildfire density for a certain day. The format of the prediction result is a grid point data file, and each grid point represents the number of wildfire fire points in the grid area.
[0034] Step 2: Analyze the set of transmission lines in each grid, and analyze the overlapping of the longitude and latitude of each tower of the transmission line with each grid. When the tower of the line falls in the grid, it means that the line passes through the grid; Lines do not pass through this grid.
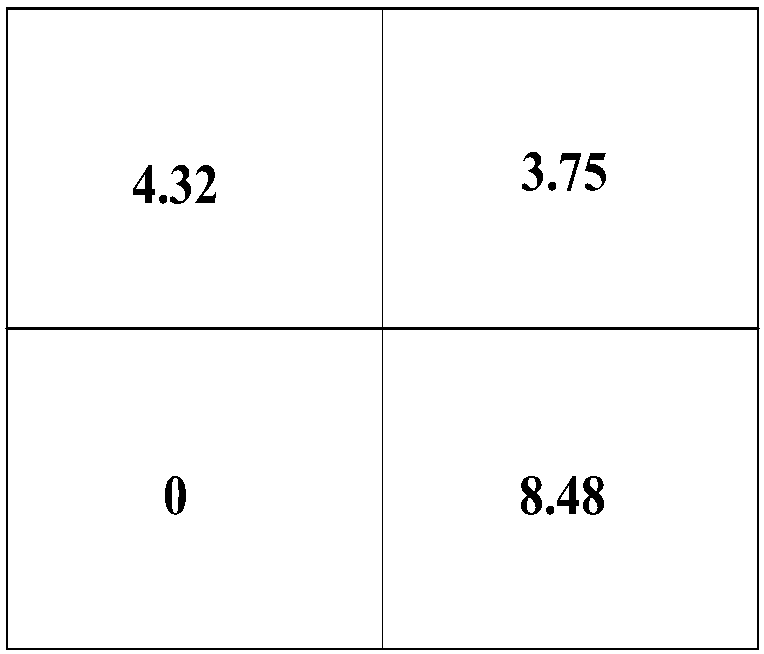
[0035] Such as figure 1 As shown, the grid numbering method is as follows: the upper left grid is numbered 1, the upper right grid is numbered 2, the lower left grid is numbered 3, and the lower right grid is numbered 4. Through analysis, the set of transmission lines in each grid is o...
Embodiment 2
[0048] Corresponding to the foregoing method embodiments, this embodiment discloses a system for drawing a distribution map of mountain fire disaster risks in a power grid.
[0049] The system of this embodiment includes:
[0050] The first processing unit is used to divide the grid and obtain the grid fire density prediction results of each grid;
[0051] The second processing unit is used to analyze the set of transmission lines in each grid, and perform overlapping analysis on the longitude and latitude of each tower of the transmission line and each grid. When the tower of the line falls in the grid, it means that the line passes through the grid. Otherwise, it is considered that the line does not pass through the grid; and the grid risk degree of each line is calculated;
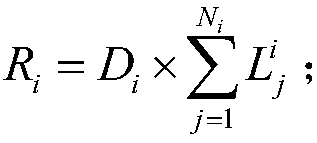
[0052] The third processing unit is used to calculate the power grid wildfire risk of each grid, and the calculation formula is as follows:
[0053]
[0054] In the formula, R i is the grid fire r...
PUM
 Abstract
Description
Claims
Application Information
 - R&D
- Intellectual Property
- Life Sciences
- Materials
- Tech Scout
- Unparalleled Data Quality
- Higher Quality Content
- 60% Fewer Hallucinations
Browse by: Latest US Patents, China's latest patents, Technical Efficacy Thesaurus, Application Domain, Technology Topic, Popular Technical Reports.
© 2025 PatSnap. All rights reserved.Legal|Privacy policy|Modern Slavery Act Transparency Statement|Sitemap|About US| Contact US: help@patsnap.com


