Stability monitoring method for closed-loop system driven by data
A closed-loop system, data-driven technology, applied in the direction of electrical digital data processing, special data processing applications, instruments, etc., can solve the lack of closed-loop system stability monitoring and other problems
- Summary
- Abstract
- Description
- Claims
- Application Information
AI Technical Summary
Problems solved by technology
Method used
Image

Examples
specific Embodiment approach 1
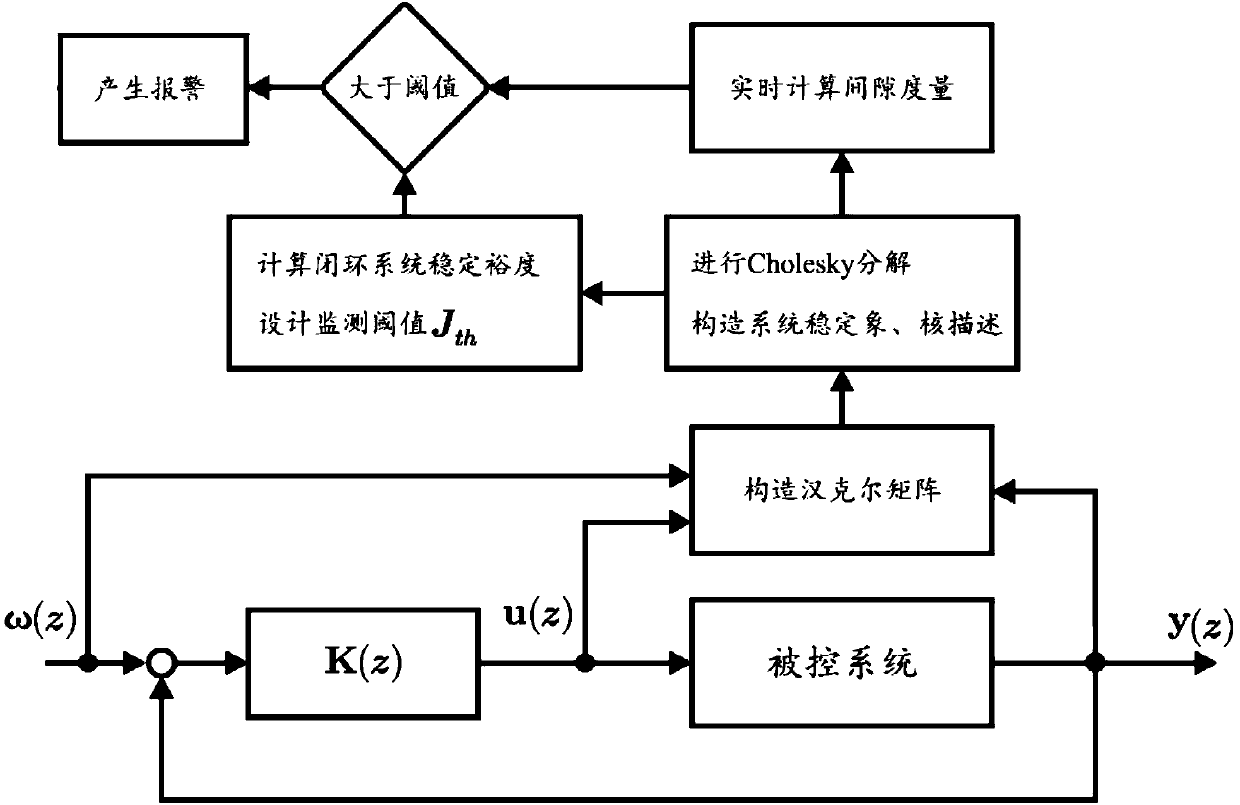
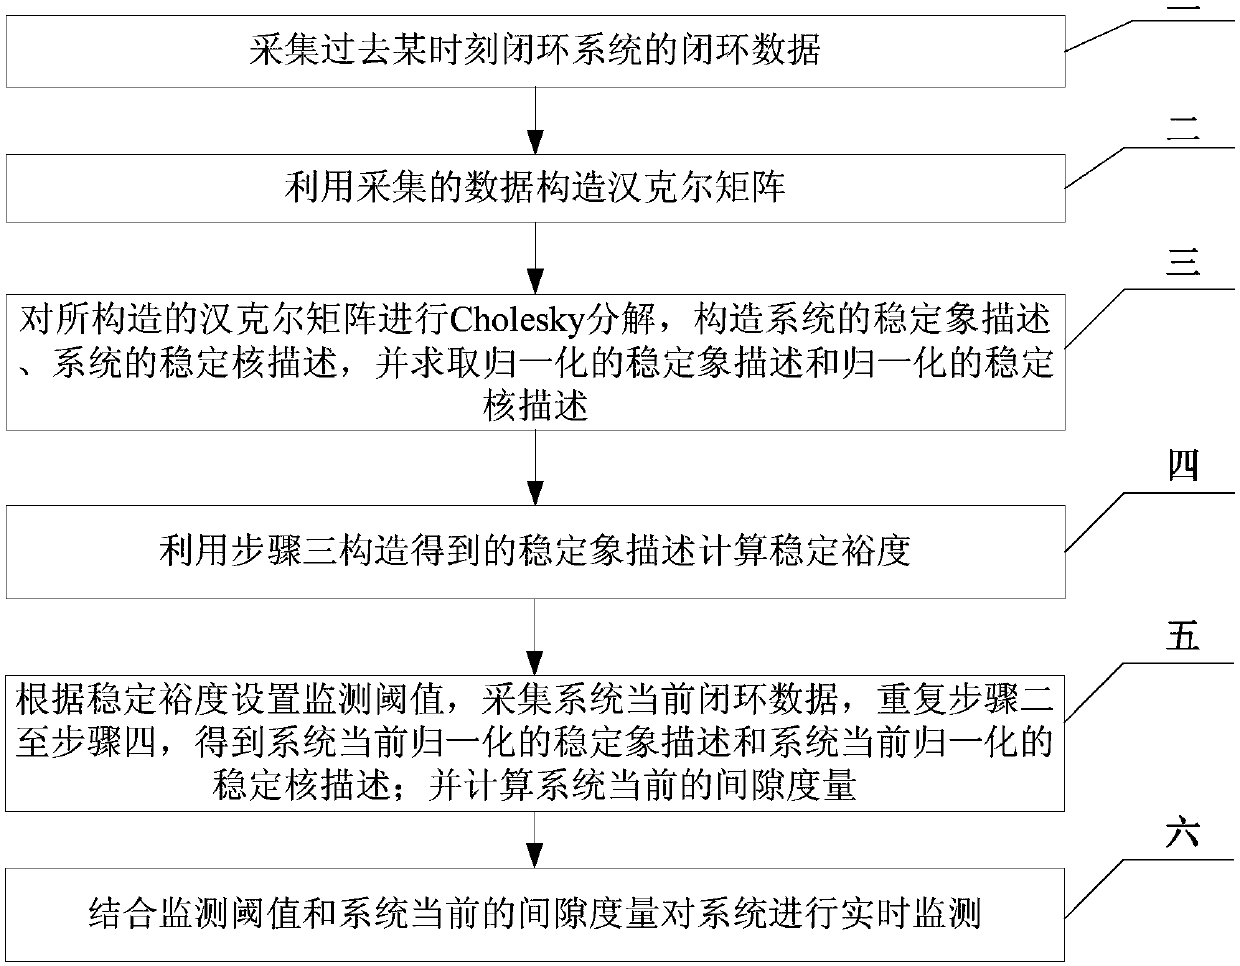
[0060] Specific implementation mode one: combine figure 1 , figure 2 To describe this embodiment, a data-driven closed-loop system stability monitoring method provided in this embodiment specifically includes the following steps:
[0061] Step 1. Collect the closed-loop data of the closed-loop system at a certain moment in the past, including the input signal, output signal and reference input signal of the closed-loop system;
[0062] Step 2, using the collected data to construct a Hankel matrix;
[0063]Step 3, carry out Cholesky decomposition to the constructed Hankel matrix, construct the stable image description of the system, the stable kernel description of the system, and obtain the normalized stable image description and the normalized stable kernel description;
[0064] Step 4, using the stable image description obtained in step 3 to calculate the stability margin;
[0065] Step 5. Set the monitoring threshold according to the stability margin, collect the curren...
specific Embodiment approach 2
[0067] Specific embodiment two: the difference between this embodiment and specific embodiment one is that step two specifically includes the following steps:
[0068] Step 21, using the feedback controller K(z)=(A, B, C, D) parameters in the closed-loop system to construct a stable filter Among them, A is the system matrix of the feedback controller, B is the input matrix of the feedback controller, C is the output matrix of the feedback controller, and D is the through matrix of the feedback controller;
[0069] Step 22. Calculate the filtered reference input signal w(z) by the following formula:
[0070]
[0071] Among them, ω(z) is the reference input signal;
[0072] Step two and three, select the appropriate dimension parameter s p ,s f and N, construct a Hankel matrix about the system filtered reference input signal w(z), input signal u(z), and output signal y(z):
[0073]
[0074]
[0075]
[0076]
[0077] in, w k Indicates the sampling value ...
specific Embodiment approach 3
[0079] Specific embodiment three: the difference between this embodiment and specific embodiment two is that step three specifically includes the following steps:
[0080] Step 31, do the following Cholesky decomposition to the constructed Hankel matrix:
[0081]
[0082]
[0083] in, and Represents the decomposed matrix;
[0084] Step 32. Build the stable image description of the system
[0085]
[0086] in, Describes the correspondence for the system stability image weight, Describes the correspondence for the system stability image weight;
[0087] Step 33, obtain the following left null space:
[0088]
[0089] in, corresponds to the left null space where weight, for the resulting left null space corresponding to components; build a stable core description of the system
[0090]
[0091] Step 3 and 4: Obtain the normalized stable image description and a normalized stable kernel description
[0092]
[0093]
[0094] in, ...
PUM
 Abstract
Description
Claims
Application Information
 - R&D
- Intellectual Property
- Life Sciences
- Materials
- Tech Scout
- Unparalleled Data Quality
- Higher Quality Content
- 60% Fewer Hallucinations
Browse by: Latest US Patents, China's latest patents, Technical Efficacy Thesaurus, Application Domain, Technology Topic, Popular Technical Reports.
© 2025 PatSnap. All rights reserved.Legal|Privacy policy|Modern Slavery Act Transparency Statement|Sitemap|About US| Contact US: help@patsnap.com