DPC-based method and system for detecting abnormality of multi-door system of rail vehicle
An anomaly detection and rail vehicle technology, applied in the direction of railway vehicle testing, etc., can solve the problems of different parts, many parts, and inability to detect the abnormality of subway vehicle door system, and achieve good universality and reduce repetition.
- Summary
- Abstract
- Description
- Claims
- Application Information
AI Technical Summary
Problems solved by technology
Method used
Image

Examples
Embodiment Construction
[0043] The present invention will be further described below in conjunction with the accompanying drawings. The following examples are only used to illustrate the technical solution of the present invention more clearly, but not to limit the protection scope of the present invention.
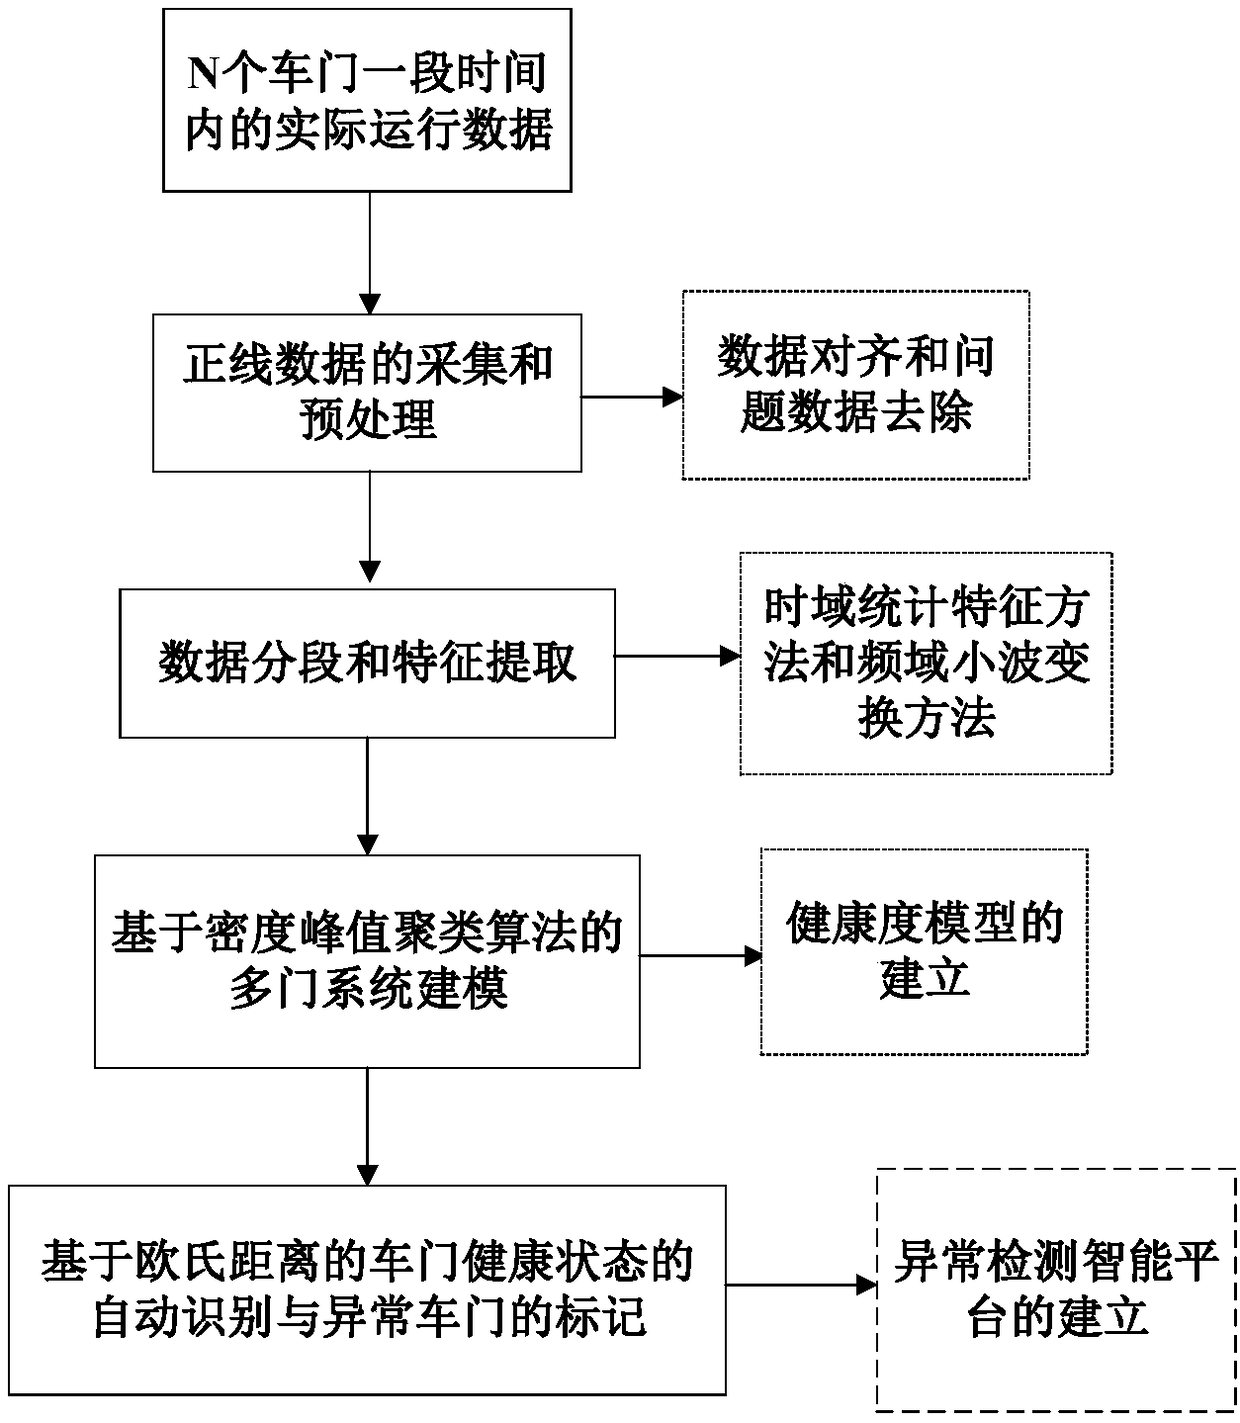
[0044] figure 1 It is a flow chart of the abnormality monitoring method of the vehicle multi-door monitoring system in a specific embodiment of the present invention; refer to figure 1 It shows that in this embodiment, the health degree modeling based on the cumulative data of the main line is performed on multiple doors of a subway to obtain the health degree model of the multi-door system, and then the periodic horizontal comparison between the doors is carried out, and the abnormal doors are marked. Complete the automatic identification of the health status of the car door. The whole process includes the following steps:
[0045] Step (A), the collection and preprocessing of the main line ...
PUM
 Abstract
Description
Claims
Application Information