Steel quality detection method based on interval shadow set and density peak clustering

A quality detection method and density peak technology, applied in character and pattern recognition, instruments, computer parts, etc., to achieve the effect of improving work efficiency

Active Publication Date: 2019-06-07
CHONGQING UNIV OF POSTS & TELECOMM
View PDF5 Cites 7 Cited by
  • Summary
  • Abstract
  • Description
  • Claims
  • Application Information

AI Technical Summary

Problems solved by technology

[0008] For above-mentioned noise detection problem, the present invention is to provide a kind of density peak clustering improvement algorithm (ISS-

Method used


Image

  • Steel quality detection method based on interval shadow set and density peak clustering
  • Steel quality detection method based on interval shadow set and density peak clustering
  • Steel quality detection method based on interval shadow set and density peak clustering

Examples


Embodiment 1

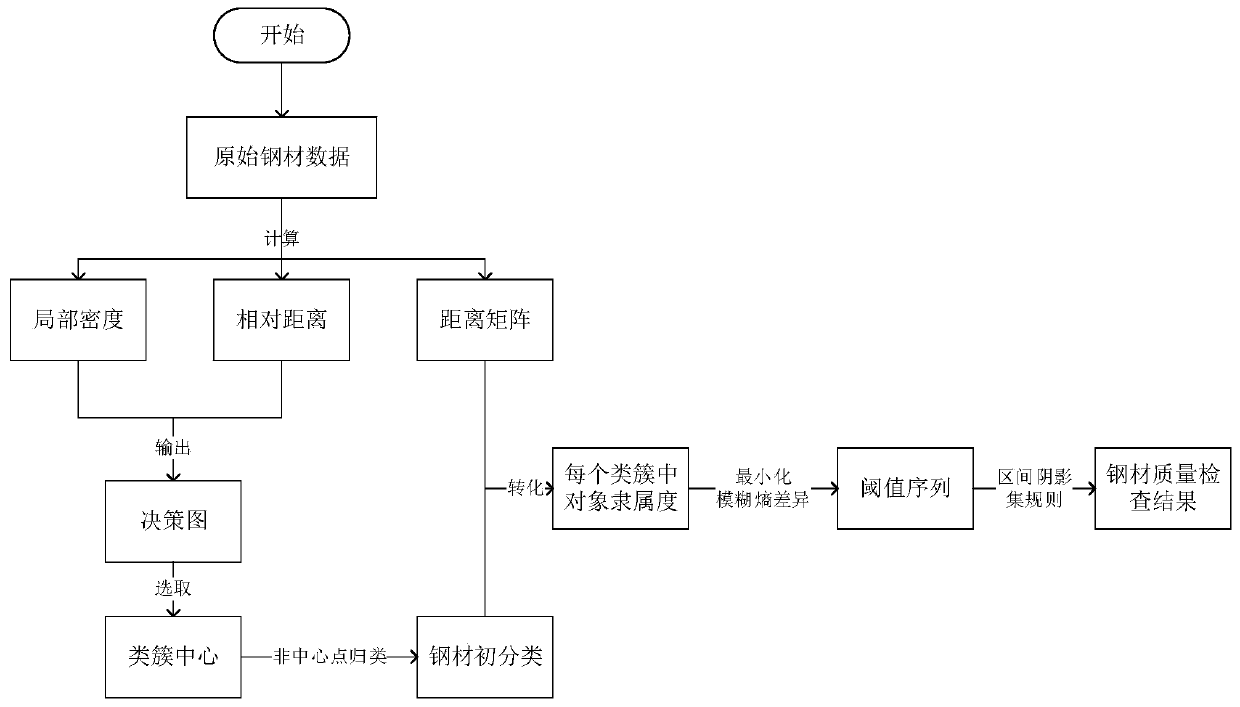
[0043] The present invention adopts a steel quality detection method based on interval shadow set and density peak clustering, and the following is abbreviated as ISS-DPC algorithm based on interval shadow set and density peak clustering; figure 2 As shown, the steel quality inspection method of the present invention includes the following steps:

[0044] Input: Data set S.

[0045] Output:

[0046] Step 1: Initialize parameter d c ;

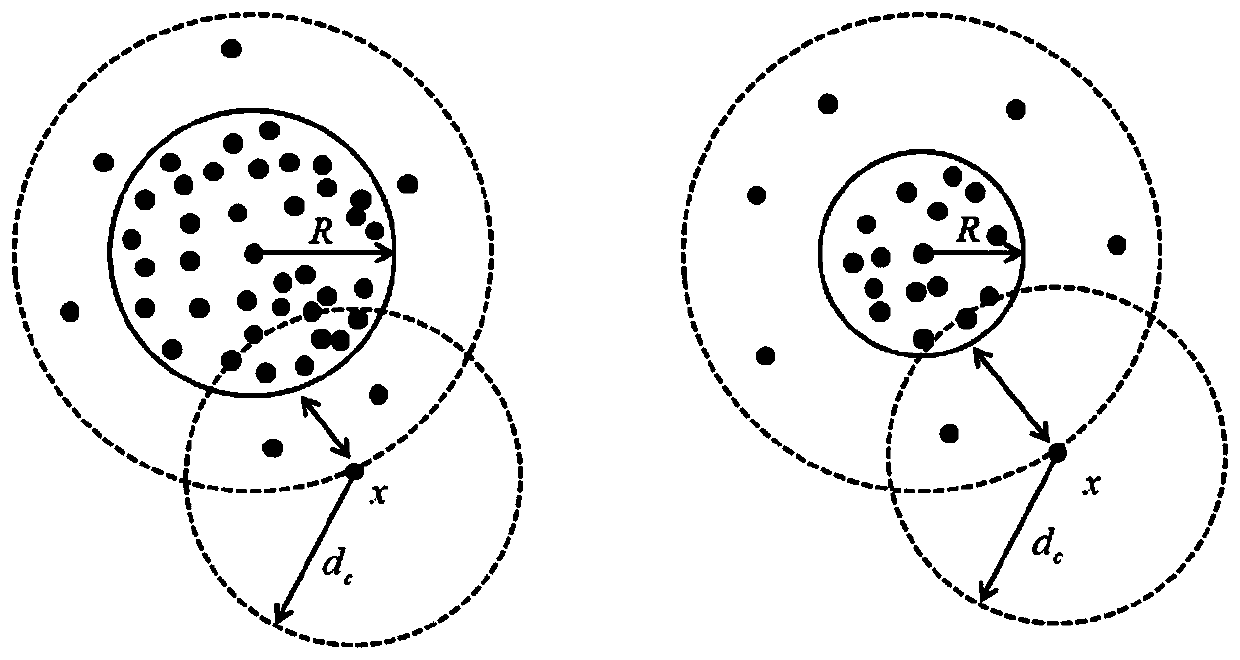
[0047] Step 2: Calculate the local density ρ of each point by formula (1) or (2), and calculate the relative distance δ by formula (3);

[0048]

[0049]

[0050]

[0051] Where ρ i Represents the local density of the i-th object; δ i Indicates the relative distance of the i-th object; d ij Means x i With x j Distance between, parameter d c Is the cutoff distance; x i Represents the i-th object in the steel data set S; S={x 1 ,x 2 ,...,X n }; n represents the total number of objects in the steel data set; I S Represents the object index set, I S ={k∈I ...

Embodiment 2

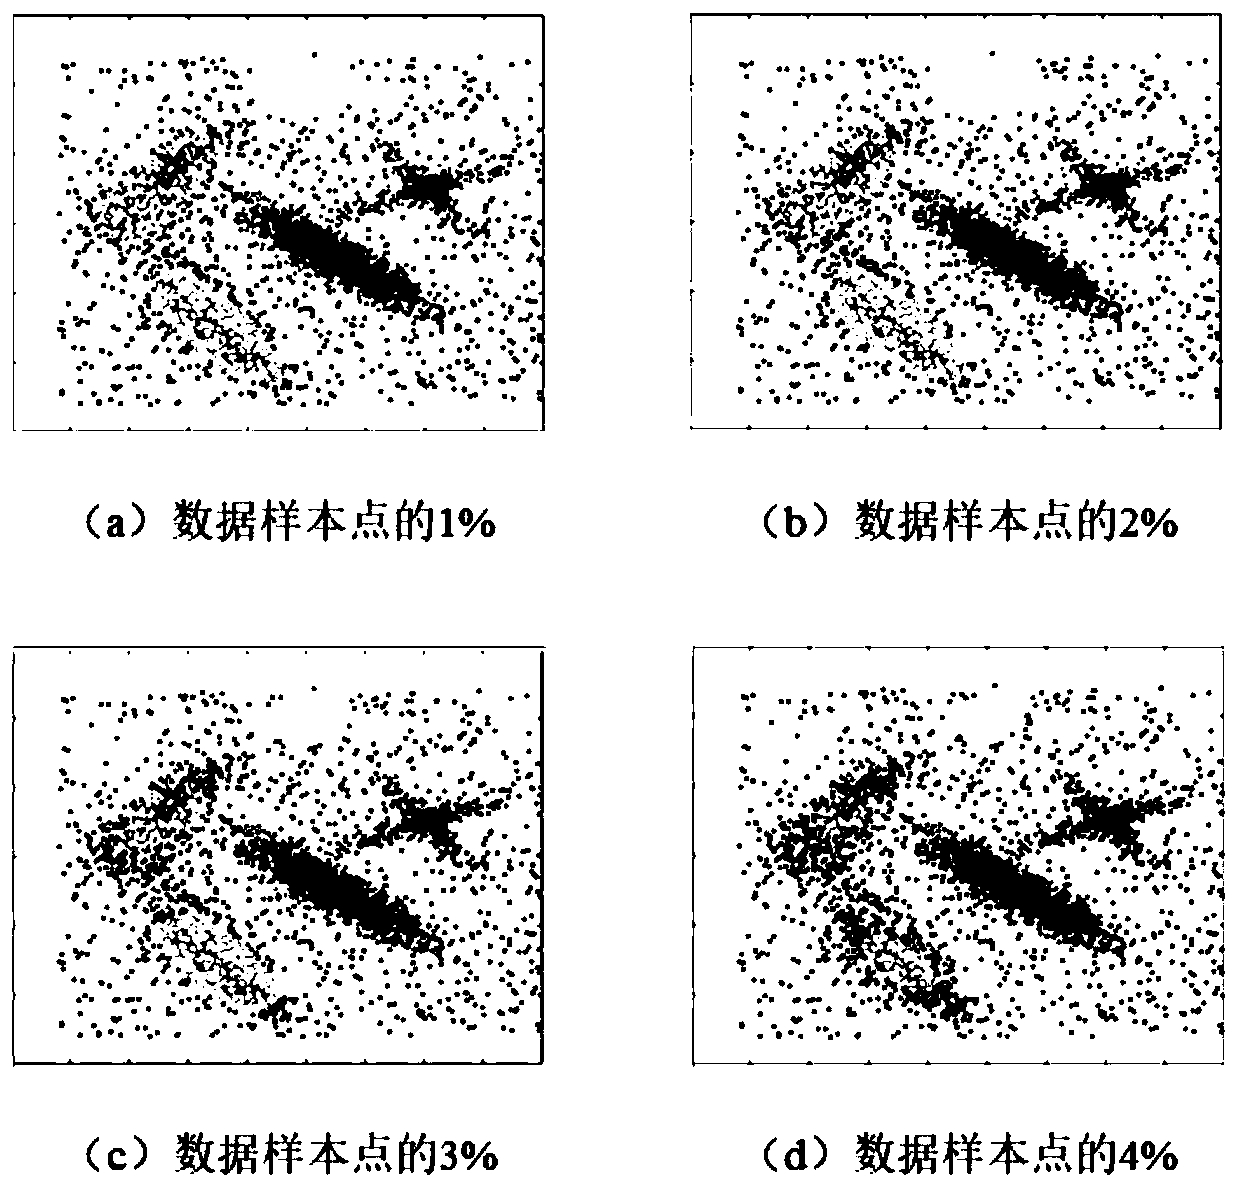
[0094] This example takes the steelmaking data of a steel plant as an example. For the convenience of presentation and explanation of the problem, the present invention selects two columns of data as an example for cluster analysis. The selected two columns of data are the target end temperature in the furnace and the molten steel temperature, total 800 pieces of data. As shown in Table 1, the first 10 data in the original table are listed:

[0095] Table 1 Part of the original data

[0096]

[0097] In the original data table, each row of data records related indicators in the steelmaking process. When the target end temperature in the furnace differs from the molten steel temperature, the higher the quality of the steel produced; on the contrary, the greater the difference, the lower the quality of the steel. Therefore, this example uses cluster analysis to quickly determine the quality of steel.

[0098] Table 2 lists the distance matrix of the first 10 data in the original tabl...


PUM


Abstract

The invention belongs to the field of steel quality testing, and particularly relates to a steel quality detection method based on an interval shadow set and density peak clustering. The method comprises the steps of acquiring an original steel data set, and calculating a distance matrix of the original steel data set through an Euclidean distance formula; obtaining a local density matrix and a relative distance matrix through a calculation formula in density peak clustering; outputting a decision diagram of a data set in density peak clustering, selecting m clustering centers, and classifyingnon-clustering centers to obtain m class clusters; calculating a membership value of each object in the m class clusters; determining an optimal threshold sequence of m class clusters by minimizing fuzzy entropy difference; and based on the optimal threshold sequence, performing three-way classification on non-central objects in the m class clusters by adopting a classification rule according tomembership values of the non-central objects by adopting an interval shadow set, thereby determining a quality detection result of each object, namely, obtaining a quality detection result of the original steel data set. According to the invention, the quality of steel can be effectively and rapidly detected.

Description

Technical field [0001] The invention belongs to the field of steel quality testing, and specifically relates to a steel quality testing method based on interval shadow sets and density peak clustering. Background technique [0002] Metallurgical factories produce all kinds of steel, and all tests are carried out in accordance with the corresponding standards and technical documents before leaving the factory. The inspection process will generate a large amount of data, and as the production progresses, the data has exploded. Under the background of this big data, manual comparison of various data not only consumes labor costs, but is also inefficient, and even unable to complete the quality inspection work. Secondly, the attributes of the steel big data information system are not only diversified, but also have certain relevance between the attributes. Therefore, data mining methods such as granular computing theory and cluster analysis are widely used in industrial big data to ...

Claims


Application Information

Patent Timeline
IPC IPC(8): G06K9/62
Inventor 张清华陈玉洪刘学颖杨洁
Owner CHONGQING UNIV OF POSTS & TELECOMM
Why Eureka
Try Eureka