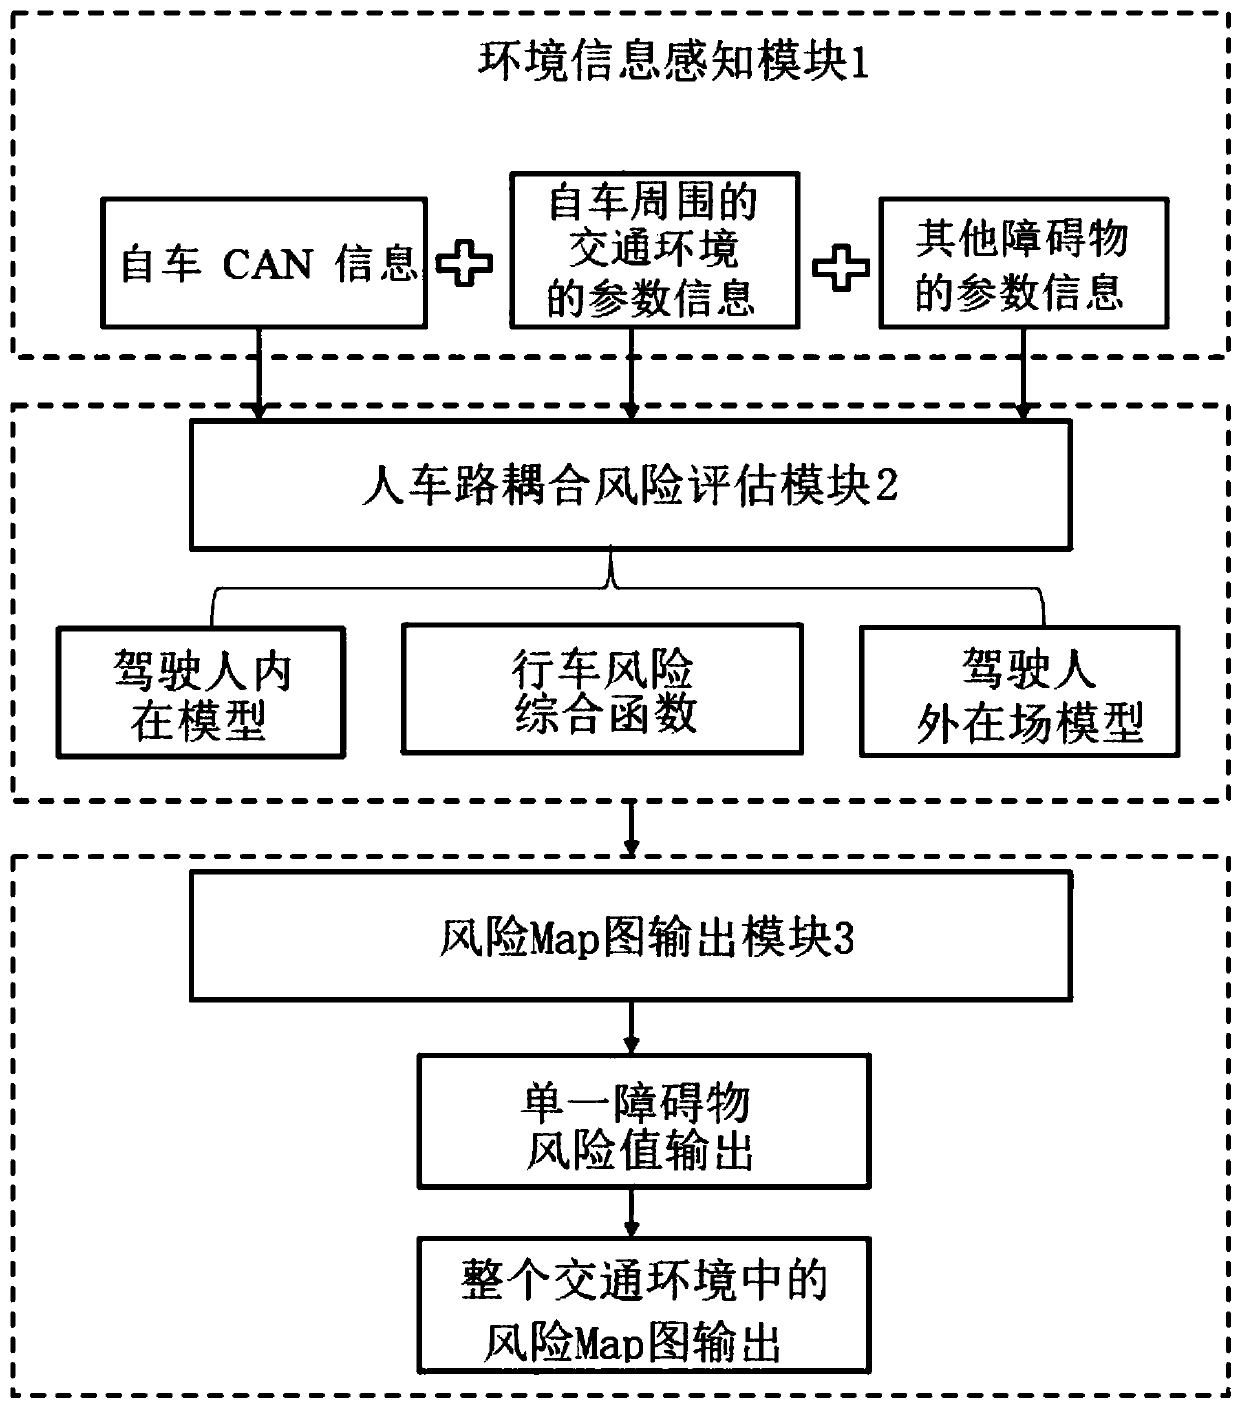
[0052] The present invention will be described in detail below with reference to the drawings and embodiments.
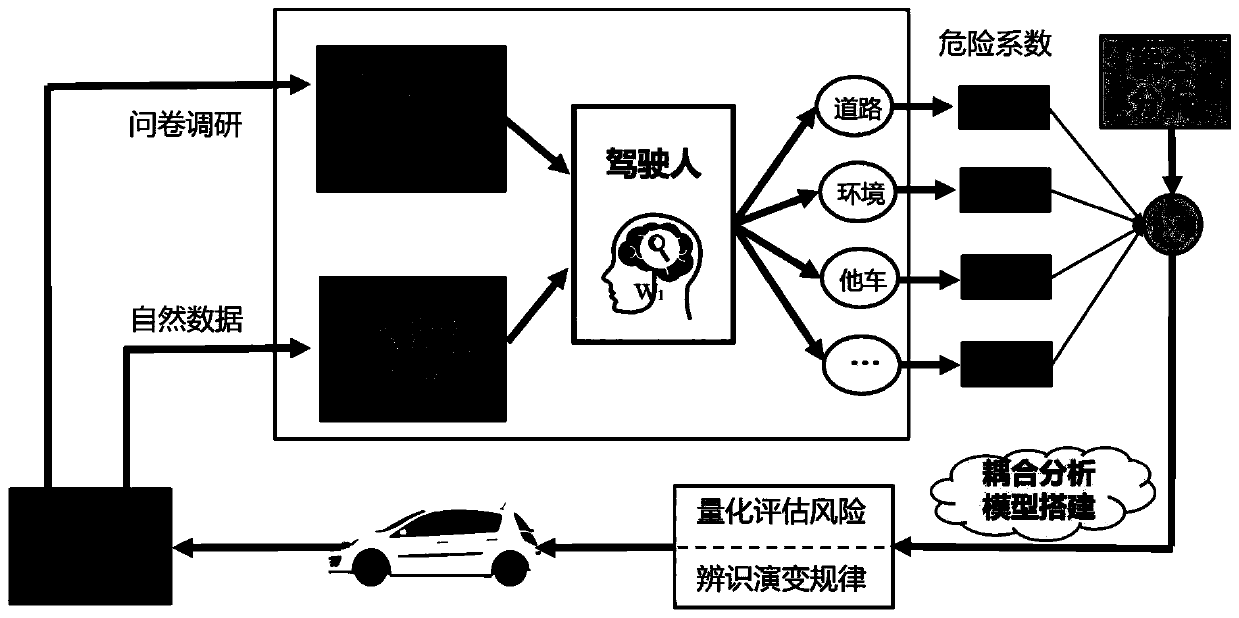
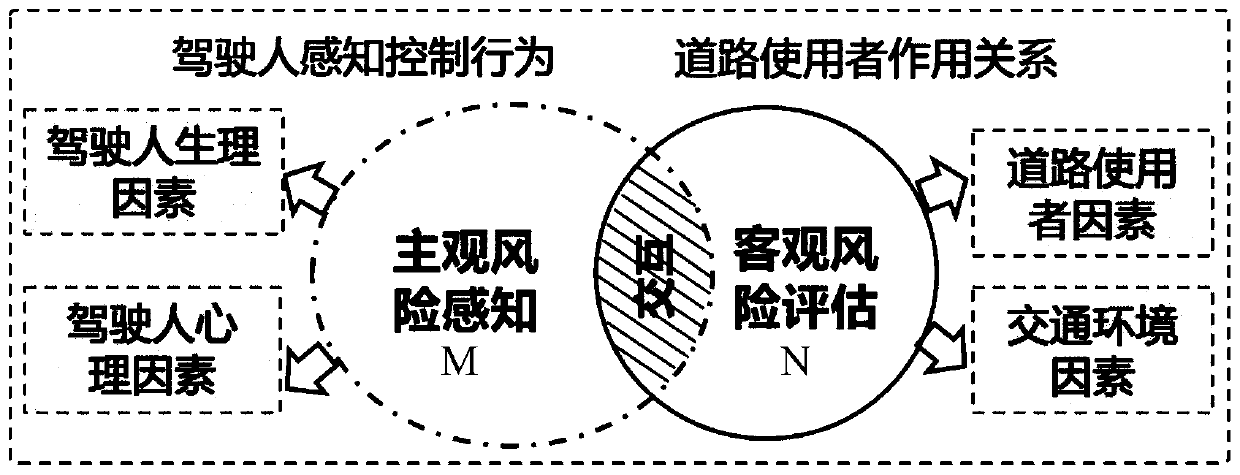
[0053] The human-vehicle-road coupling risk assessment method based on the cognitive perspective of the driver provided in this embodiment includes:
[0054] S1: Acquire parameter information of the vehicle, the traffic environment around the vehicle, and the traffic object in the traffic environment around the vehicle.
[0055] Among them, the "parameter information of the own car" is the CAN information of the own car, which includes the motion state information of the own car: such as engine speed, acceleration and deceleration, brakes, speed, gear position, steering wheel angle and GPS information; the physics of the own car Parameters: such as vehicle mass, vehicle volume, vehicle launch performance, etc.
[0056] "The traffic environment around the own vehicle" means the traffic situation in an area covered by the own vehicle as the center. "Parameter information of the traffic environment around the vehicle" includes weather conditions (sunny, overcast, rain and snow, etc.), light conditions (high light, dim yellow, dark and other visibility Ψ δ Characterization factors) and road conditions (road adhesion Ψ μ , Road curvature Ψ ρ And slope Ψ τ Wait).
[0057] "Traffic object" is essentially all objects in the traffic environment around the vehicle. "Parameter information of traffic object" includes parameter information of static traffic objects such as traffic signs, traffic lights, lane lines, road signs and other road signs. Including dynamic parameter information of other road users such as pedestrians and other vehicles (referred to as "other vehicles").
[0058] S2: Input various types of information obtained in S1 into a vehicle-mounted sensor unit, and the vehicle-mounted sensor is preset with a human-vehicle-road coupling risk assessment model 2 based on the driver's cognitive perspective. This embodiment comprehensively considers various factors affecting driving risks in the traffic environment around the own vehicle. The fields centered on the driving program are defined as internal fields, and the fields formed by other objects are defined as external fields. When the driver makes decisions through the input of external information, a coupling model of the driver's driving risk is formed.
[0059] S3, through the human-vehicle-road coupling risk assessment model 2, output the risk value of a single traffic object in the traffic environment around the vehicle, and output the risk map of the entire traffic environment around the vehicle according to the risk value of the single traffic object .
[0060] This embodiment can comprehensively consider the coupling characteristics between people, vehicles and roads, meet the driver's risk perception level, and quantify the current environmental risk value results based on a comprehensive risk assessment method based on the driver's subjective cognition and objective evaluation to ensure the safety of the vehicle to avoid obstacles
[0061] All traffic objects may pose a safety risk to the driver in the vehicle, such as figure 2 As shown, this embodiment divides the driving risk of the own vehicle into subjective risk and objective risk. Among them, in subjective risk analysis, different drivers have obvious differences in their perception of current driving risks when facing the same traffic scene. The physiological and psychological factors of the driver, such as driving skills, personality, attitude, emotion and state, etc., may affect the driver's information receiving and processing process. These factors may cause differences in the subjective measure of risk. When identifying objective risks, the characteristics of the roadway system are extracted, and each road user in the roadway system is taken as the source of objective risks, including vehicle performance, mixed traffic characteristics, pavement characteristics, and traffic signs. Considering the mechanism of its impact on driving risk, the physical characteristics between the vehicle-road system and driving risk can be discovered. Finally, the risk measurement value of the target risk attribute is established. In addition, the behavior of the driver during driving will be disturbed by various external factors, such as the road environment and the dynamic characteristics of the vehicle itself. Finally, the human-vehicle-road coupling risk assessment model 2 is established to evaluate and quantify the driving risk.
[0062] The invention combines subjective risk and objective risk, and can more accurately realize the comprehensive situation assessment under complex scenarios. The subjective risk is measured by the driver’s presence in the field; the objective risk is reflected in the driver’s presence outside the field. The objective risk is calibrated by the attributes of the traffic element itself. The specific values are given in the table. The objects existing in the field are calibrated by natural data. The comprehensive function of driving risk is part of the driver's internal field. The field strength of the entire internal field is affected by the characteristics of the driver, the road environment and the physical characteristics of the vehicle, so the degree of influence is expressed by the comprehensive function of driving risk. Such as image 3 As shown, the relationship between subjective risk perception and objective risk assessment is as follows image 3 Shown. The subjective risk can be represented by a dynamically changing ellipse M, and the objective risk can be represented by a circle N with a fixed radius. There is an interaction between subjective risk and objective risk.
[0063] Such as Figure 4 As shown, the traffic system is a complex dynamic system composed of traffic elements such as vehicles, vehicles, pedestrians, roads, and the traffic environment around the vehicle. When there is a problem with the coordination of the traffic system composed of drivers, vehicles and roads, it is likely to cause a traffic accident. When analyzing the characteristics of each traffic element, the characteristics of the driver are mainly focused on: that is, the differences between individuals due to age, gender, driving habits, driving skill proficiency, driving temperament, etc. The characteristics of drivers are mainly reflected in the driving process The differences in each link of the perception-decision-operation mechanism, drivers' physiology, psychology, habits, driving skills, etc. will lead to differences in their driving decisions and vehicle control methods, which are characterized as differences in driving behavior; Characteristics: The difference between different types of vehicles in driving speed and acceleration and deceleration and their mutual influence constitute the influence of vehicle model distribution on traffic. The specific influence can be divided according to the size of the car body (wheelbase, number of axles), At the same time, the physical characteristics of the vehicle specifically include the size of the vehicle and individual space requirements, operating performance (maximum speed, acceleration, deceleration performance, etc.), as well as vehicle dynamics (endurance, acceleration and deceleration performance, fuel consumption, etc.); road characteristics, that is, road Factors such as adhesion coefficient, road alignment, lane function and location, road facilities, location of traffic signs and markings, road alignment, geology, road structure, road system congestion, weather conditions and other factors are closely related to the safety, comfort and economy of vehicle driving characteristic. There is also a certain interaction relationship between these factors. For example, the visual and psychological reflection of the driver depends on the linear design, that is, the difference in the driver's viewing distance, that is, the calculation of the driver's viewing distance and the road alignment and vehicle speed , The braking performance of the vehicle, the measures taken by the driver to overcome the traffic object, and the weather conditions are closely related to the vehicle parameters.
[0064] In one embodiment, in S2, the human-vehicle-road coupling risk assessment model includes a driver's internal field model, a driving risk integrated function, and a road environment external field model.
[0065] The driver’s internal field model is used to take the influence of the traffic environment around the vehicle on the distance of the driver in the vehicle as the driver’s internal field effect mechanism, and use the extended time distance as a measure of the driver’s behavior The index of the field intensity distribution, mathematical description of the driver's behavior field distribution. The role of the driver's internal field model is mainly reflected in the following two aspects:
[0066] On the one hand: Because the entire internal field strength is affected by the characteristics of the driver, the road environment and the physical characteristics of the vehicle, it is also based on the expression of the field strength in the physical field The proximity and distance between a certain point in the driver's behavior field and the vehicle's distance have a certain functional relationship with the intensity of the field, and the existing technology has used traffic accident data to study the relationship between accident loss and speed. Therefore, the polynomial of the power function term of the speed is used to express the influence of the vehicle speed on the field strength. This embodiment defines the expression of the driver's internal field model as equation (1):
[0067]
[0068] In formula (1), f(D, R, V) is the comprehensive function of driving risk, which can be expressed as the risk coefficient D of the driver a , Road environment risk coefficient R a , Vehicle physical risk factor V a The functional relationship.
[0069] On the other hand, the driver in the vehicle has the role of receiver and output decision maker for the entire driving process. Therefore, in order to give a specific model of the inner field, it is necessary to define the effective area of action in the entire inner field.
[0070] According to the main channels for obtaining driver information in the traffic system, it can be known that the visual characteristics of drivers are closely related to their safe driving process. During driving, the visual discrimination ability is greatly affected, and the field of view angle becomes narrower as the vehicle speed increases. Therefore, the scope of the inner presence is now defined by the driver's visual characteristics (the driver can see the increase in the distance of visual attention and the decrease in the coverage of the line of sight when the speed increases), and calculate the presence of the object projection line segment within this range The curve integral in determines the field strength of the object.
[0071] The comprehensive function f(D, R, V) of driving risk can be expressed as formula (2):
[0072] f(D, R, V)=D a ×R a ×V a (2)
[0073] In formula (2), a is only distinguished by subscripts in this formula.
[0074] Among them, the driver's risk coefficient D a Mainly affected by driver characteristics, including personality characteristics (a. gender difference, b. age difference, c. driving temperament difference, d. driver personality difference, etc.), visual recognition characteristics (a. visual field, b. vision, c. visual adaptation, d. dazzling, etc.), behavior characteristics (a. information processing process, b. response characteristics, c. behavior characteristics, d. psychological characteristics, etc.) several parts, so select its main characteristics to build driving Human risk factor D a , In order to describe and analyze the impact of driver characteristics on driving safety. After reference, the driver's risk coefficient D is obtained a Expressed as formula (3):
[0075] D a =γe a (3)
[0076] In formula (3), the driver's risk coefficient D a Mainly related to the personality characteristics of the driver (a. gender difference, b. age difference, c. driving temperament difference, d. driver personality difference, etc.). γ is the driver’s personality parameter, which can be calibrated through the driver’s questionnaire survey, e a It is the fitting curve of the driver's risk degree, and the index a is the curve parameter, and its magnitude is expressed by the driver's aggressiveness. The driver's risk degree fitting curve can be directly fitted through the driving process operating parameters, and the aggressive progress can be obtained through the driver's subjective questionnaire.
[0077] Among them, the road environmental risk coefficient R a Mainly attached to the road Ψ μ (μ i ), road curvature Ψ ρ (ρ i ), slope Ψ τ (τ i ) And visibility Ψ δ (δ i ) And other factors, so it can be defined as formula (4):
[0078] R a =Ψ μ (μ i )×Ψ ρ (ρ i )×Ψ τ (τ i )×Ψ δ (δ i ) (4)
[0079] The pavement adhesion Ψ in equation (4) μ (μ i ), road curvature Ψ ρ (ρ i ), slope Ψ τ (τ i ) And visibility Ψ δ (δ i ) Are all from the "parameter information of the traffic environment around the vehicle" collected by S1. The set of risk evaluation functions corresponding to each influencing factor listed in Table 1 below:
[0080] Table 1
[0081]
[0082]
[0083] Among them, the vehicle physical risk coefficient V a Mainly related to the performance of the self-car i itself, such as factors such as vehicle mass, vehicle volume and vehicle starting performance, so it can be defined as formula (5):
[0084] V a =V a (M, L, X) = M (m i , T i , V i )×L×X (5)
[0085] In formula (5), M is the virtual mass of the vehicle, which is expressed as formula (6):
[0086]
[0087] In formula (6), m i Is the actual physical mass of self-car i, v i Is the speed of own car i. It's about self-car i speed v i The function of is used to describe the influence of speed on driving risk. It can be calibrated that α, β and γ are undetermined constants by analyzing the relationship between accident loss and speed. T i Is the type of self-car i, and its determination method is as follows:
[0088] First, select a type of object as the reference, and record the T value corresponding to the reference object as 1. Then, calculate the T value of other types of objects as follows:
[0089]
[0090] Among them, ξ * As the average number of deaths in accidents caused by reference objects (for simplicity, the average number of accidents is used to measure the accident loss), ξ i For T i The average number of fatalities in accidents caused by types of objects
[0091] In formula (5), L is the vehicle volume parameter, expressed as L=W i ·H i ·L i , W i Is the width of own car i, H i Is the height of the vehicle i, L i Is the length of own car i.
[0092] In formula (5), X is a vehicle performance evaluation index, which is usually used to evaluate vehicle performance indexes: power performance, fuel economy, braking performance, handling stability, ride comfort, and passing performance. Different vehicle types can be obtained by looking up the vehicle performance table.
[0093] In the external presence model of the road environment, since all traffic objects may pose a safety threat to drivers, the threat generated by the traffic objects is abstracted as a repulsive force field around it, that is, the external field. According to the principle of multi-agent obstacle avoidance, the driver will choose the path with the lowest risk assessment index when making a decision, that is, the driver's planned itinerary will create an attractive field for it. Among them, the strength of the external field generated by the object is determined by its attributes.
[0094] The traffic objects that exist in the field are distinguished. Based on the visual characteristics of the driver, the traffic objects felt by the driver in the field of vision are specifically divided into the following categories:
[0095] (1) Static traffic object
[0096] The risk influencing factor produced by this type of stationary traffic object is mainly determined by its own volume, which is expressed as the size of the projected volume in the driving safety field, and the risk coefficient is defined as S j.
[0097] (2) Constraint traffic objects
[0098] The risk influencing factors generated by restraint traffic objects (such as lane lines, guardrails, road edges, road construction warning signs, etc.) are mainly determined by factors such as restraint types and widths, which are manifested in the psychological pressure on drivers in the traffic safety field The size of the risk factor is defined as S y.
[0099] (3) Running motor vehicles
[0100] Motor vehicles are usually moving and have the consciousness of autonomous driving. There is a risk that other motor vehicles on the road become their own vehicles unconsciously. The resulting risk influencing factors are mainly determined by factors such as the driving speed of the motor vehicle, the size of the motor vehicle, and the location of the vehicle. It is manifested in the decision-making impact on driving the self-driving vehicle in the driving safety field. The risk coefficient is defined as S c.
[0101] (4) Sports pedestrians
[0102] Pedestrians are susceptible to driving under their own conditions to make some behaviors that affect the driving of the driver. The risk influencing factors are mainly determined by factors such as free walking range, type, and behavioral norms, which are manifested in the decision-making of driving the vehicle in the driving safety field. To judge the impact, the risk coefficient is defined as S r.
[0103] (5) Non-motorized vehicles
[0104] The behavior of non-motor vehicles is affected by people's subjective consciousness, and it is more convenient and irregular to walk on the road because of its smaller size. The resulting risk influencing factors are mainly determined by factors such as free walking range, flexibility, etc., and are manifested in the decision-making impact on driving the self-driving vehicle in the driving safety field. The risk coefficient is defined as S f.
[0105] The risk coefficient values of the above various types of traffic objects can be obtained by looking up the table, for example, the risk coefficient S values of different influencing factors provided in Table 2 below.
[0106] Table 2
[0107]
[0108]
[0109] Figure 5 Shows the effective area of the entire inner field. Figure 5 Where the two-dimensional coordinate system of the vehicle of own vehicle i is OXY, O represents the origin of vehicle i, X represents the X axis of the traveling direction of vehicle i, and Y represents the origin O passing through vehicle i and is perpendicular to X axis and Y axis. P x , P, P y The solid line formed by the three-point connection is an equipotential line, P x ′, P y The dotted line formed by connecting two points is another equipotential line. P x And P x ′ Are located on the X axis, P y And P y ′ Are located on the Y axis, P(x,y) is a point on one of the equipotential lines, x is the vertical distance from the point on the equipotential line to the Y axis, and y is the point on the equipotential line to the X axis The vertical distance. Self-vehicle i is a vehicle driven by a driver, and will be referred to as self-vehicle i below. Vehicles other than own car i are called "other cars", "other cars" include "front car" and "back car", among which, "front car" is the front vehicle in the field of view of own car i, " The “back vehicle” refers to the rear vehicle within the field of view of the own vehicle i. According to the type of driver and the speed of the driving vehicle, the driving direction of the vehicle i is taken as the X axis, and within the driving range centered on the vehicle i, a range area with equal potential field is constructed according to the principle of visual characteristics. In this embodiment, the radius r of the region where the potential field is equal is defined as:
[0110] l (x,y) =r-(1-δ(v i ))r|sinθ (x,y) | (7)
[0111] In formula (7), l (x,y) Is the distance between P(x, y) and the origin O of vehicle i, δ(v i ) Is obtained by the following formula (8), θ (x,y) Is the angle formed by the line between P(x,y) and the origin O of the vehicle i and the X axis, and Figure 5 Theta in.
[0112] δ=OP x /OP y (8)
[0113] In formula (8), OP x Represents the point P on the X axis on the first equipotential line x The distance from the origin O, OP y Represents the point P on the Y axis on the equipotential line y The distance from the origin O. Obviously, the value of δ is related to the speed v of the vehicle i i Correlation, that is, the faster the speed, the narrower the line of sight of the driver of own car i, therefore, δ can be expressed as δ(v i ).
[0114] Change the above formula (8) to the following formula (9):
[0115]
[0116] Thus, the basic field strength E of the driver of own vehicle i at any point in the space is obtained D The calculation model of is shown in formula (10):
[0117]
[0118] In formula (10), f(D, R, V) is the comprehensive function of driving risk, which can be calculated by formula (2); v i Is the traveling speed of own car i, Is the polynomial degree of the power function term of speed, which can be taken as: Quantitative to be standardized; Is the unit vector, which means E D Is a directional vector; l (x,y) It represents the distance between the point P(x, y) on the equipotential line and the origin O of the self-vehicle i; h represents the polynomial degree of the distance, which can be taken as: h=1, 2, 3..., to be quantified.
[0119] Take car following conditions as an example for analysis. Under car following conditions, when the relative speed of vehicle i and the vehicle ahead is high, the driver of self vehicle i will first perceive the change in the perspective of the vehicle ahead. Will follow the changes in the perspective of the vehicle ahead and manipulate the speed v i. When the relative speed of the vehicle i and the vehicle ahead is low, that is, the rate of change of the driver’s vehicle in front of the vehicle will be lower than the perception threshold k t When the driver of own vehicle i can keep the current speed unchanged, until the cumulative change in the viewing angle exceeds the perception threshold k t At this time, the car-following distance that the driver will perceive has also changed, so corresponding measures will be taken to compensate for the difference between the current car-following time and the safe time. In other words, the driver’s visual characteristics (the change in the driver’s front vehicle perspective) can affect the driver’s manipulation of the vehicle, and perceive the relative speed of the vehicle i and the vehicle ahead, the rate of change in viewing angle and the perception threshold k t The relationship can be expressed as the following formula (11):
[0120]
[0121] In formula (11), θ is the front view of the driver of vehicle i, Δv is the relative speed of vehicle i and the vehicle ahead, D p Is the distance between the vehicle i and the vehicle ahead.
[0122] According to Webers' law, when the vehicle i is close to the vehicle ahead and the driver’s viewing angle of the vehicle in front increases by 10%, the distance D between the vehicle i and the vehicle ahead can be perceived p Significant changes have taken place. When the vehicle i moves away from the vehicle ahead and the driver’s perspective of the vehicle ahead is reduced by 12%, the driver will perceive the change in the perspective of the driver of the vehicle i. At this time, the driver of own car i always maintains a certain headway as a safety margin for car following. According to Winsum research, the vehicle distance D between own car i and the preceding car p It can be expressed as (12):
[0123] D p = T p v s (12)
[0124] In formula (12), t p Is the time between front and rear vehicles (s); v s It is the driving speed of the vehicle in a stable car following state.
[0125] Construct a range area with equal potential field according to the principle of visual characteristics, and then define the range radius of equal potential field as 1, such as Figure 5 As shown, the partial ellipse shape enclosed by the equipotential lines is determined according to the driver's field of view. If the vehicle in front decelerates, the relative speed of the vehicle i and the vehicle in front of it is small, and the driver's rate of change in the view angle of the vehicle in front does not reach the perception threshold k t , The driver of own car i will keep the original speed and continue to move forward until the vehicle distance D between own car i and the preceding car p The change leads to the threshold g(g=10%*k t =0.1k t ) The accumulated change of the driver’s front vehicle perspective is reached. Therefore, the driver of own vehicle i mainly selects the change in the viewing angle of the preceding vehicle in the width direction to observe the preceding vehicle as a control input signal, thus the following equations (13) and (14) can be obtained
[0126]
[0127]
[0128] According to formula (13) and formula (14), there is formula (15):
[0129]
[0130] D d =D p -JND (16)
[0131]
[0132] In formulas (13) to (17), W is the width of the vehicle in front, D d It is the distance between the vehicles when the driver of own vehicle f perceives the deceleration of the preceding vehicle, which varies according to the visual characteristics of each driver; D p Is the distance between the vehicle i and the vehicle ahead, which is collected by the sensor of vehicle i; a i Is the acceleration taken by the driver of own vehicle i, that is, the magnitude of the control input signal; a is the acceleration of the preceding vehicle; c and d are constants, usually c>0, d<0; ε is random error; e, f They are all parameters that comply with the Webers law, and generally take e = 1.04 and f = 0.72. JND is a reflection threshold used to indicate the change in the distance between vehicles from the deceleration of the preceding vehicle to the perception of the relative speed by the driver of the following vehicle. t represents the deceleration timing from the vehicle in front, generally t is small.
[0133] Through the above analysis, it can be seen that in the process of modeling using the dynamic visual characteristics of the driver, the speed, acceleration and safe driving distance of the driving vehicle need to be constrained, so as to ensure the connection variable between the visual change and the manipulation behavior, that is, the perception threshold. Reasonableness.
[0134] According to equation (10), the human-vehicle-road coupling risk assessment model 2 of the complete transportation system can be constructed as the following equation (18):
[0135]
[0136] In formula (18), E s Indicates the field strength of the driving safety field in the area where the traffic environment around the own vehicle is located, that is, the risk value of a single traffic object in the traffic environment around the own vehicle in S3; S represents the value of the risk coefficient caused by different attribute traffic objects; v j Indicates the speed of the traffic object (when the traffic object is stationary, v j =0); v i Indicates the speed of vehicle i; δ(v i ) Is calculated by formula (8); θ (x,y) It is the angle formed by the line between the point P(x, y) on the equipotential line in the effective action area of the vehicle i and the origin O of the vehicle i and the X axis; l (x,y) Is the distance between the point P(x, y) and the origin O of the own vehicle i, calculated by equation (7); Both and h are to be quantified.
[0137] There are many undetermined parameters in the unified driving risk influencing factor coupling model due to different object attributes. The specific mathematical model can be obtained by calibrating the parameters. The driving risk influencing factor coupling model itself has many preset parameters, including the driver's risk coefficient D, which is obviously contained in f(D, R, V) a , Road condition influence coefficient R a , Vehicle physical risk factor V a Wait for the attribute parameter S of different traffic objects in the driver's vision and so on. The accuracy of these parameters directly affects the final risk assessment results.
[0138] This embodiment The device for human-vehicle-road coupling risk assessment based on the cognitive perspective of the driver provided in this embodiment includes an environmental information perception module 1, a coupling risk assessment module 2, and a risk map output module 3:
[0139] Such as figure 1 As shown, the environment information perception module 1 is used to obtain and output parameter information of the vehicle, the traffic environment around the vehicle, and the traffic object in the traffic environment around the vehicle. Among them: "parameter information of the own vehicle", "traffic environment around the own vehicle" and "parameter information of the traffic object" have been described in detail above, and will not be repeated here.
[0140] The coupling risk assessment module 2 is pre-installed in the on-board sensor unit. The on-board sensor unit obtains various types of information from the environmental information perception module 1 and sends it to the coupling risk assessment module 2. The coupling risk assessment module 2 is used to describe the driver, The coupling relationship between road users and the road environment and the driving risk of the traffic environment composed of the three.
[0141] The risk map output module 3 is used to output the risk value of a single traffic object in the traffic environment around the vehicle and the risk map of the entire traffic environment around the vehicle.
[0142] The coupling risk assessment module 2 is pre-set with a driver's internal field model 21, a driving risk integrated function 22 and a road environment external field model 23.
[0143] The driver’s internal field model 21 is used to consider the influence of the traffic environment around the vehicle on the distance generated by the driver as the driver’s internal field effect mechanism, and the extended time distance is used as an indicator to measure the intensity distribution of the driver’s behavior field. The mathematical description of the driver's internal field distribution. In the real traffic environment around the self-car, people, cars, and roads participate together. Therefore, in the analysis process, it can be concluded that the driver's manipulation behavior is always restricted and affected by the external environment. Degeneration, dynamics and individual differences.
[0144] The driving risk integrated function 22 is expressed as the above-mentioned formula (2), which will not be explained in detail here.
[0145] In the road environment external presence model 23, the present invention defines all objects (moving or stationary) in the surrounding environment of the driving vehicle as traffic objects (including vehicles, lane markings, pedestrians, etc.). Since all traffic objects may pose a safety threat to drivers, the threat generated by traffic objects is abstracted as a repulsive field around it, that is, the external field. According to the principle of multi-agent obstacle avoidance, the driver will choose the path with the lowest risk assessment index when making a decision, that is, the driver's planned itinerary will create an attractive field for it. Among them, the strength of the external field generated by the object is determined by its attributes.
[0146] The coupling risk assessment module 2 is constructed as the above formula (18). Through the coupling risk assessment module 2, it is possible to analyze the impact of each participating element in the transportation system on driving risk and the coupling relationship between them, and establish the coupling model of each element of the transportation system. Starting from the multidimensional nature of the risk composition, based on Drivers, road users, road environment, etc. quantify and output the risk values faced by drivers in the process of driving, avoiding the one-sidedness of considering a certain influencing factor to study driving risks, and also expanding the scope of application of the model.
[0147] This device establishes a mathematical model of human-vehicle-road coupling risk assessment based on the driver’s cognitive perspective, taking into account the driver’s visual characteristics and driving behavior characteristics to describe stationary objects, moving objects, driver characteristics and road The driving risks constituted by traffic factors such as conditions are closer to the subjective perception of drivers, providing support for accurate risk assessment of the road environment. Through the unified description of the driver's behavior characteristics, traffic environment characteristics and vehicle state characteristics in the model, it also considers the dynamic change process of driving risk with time and space changes.
[0148] Finally, it should be pointed out that the above embodiments are only used to illustrate the technical solutions of the present invention, but not to limit them. A person of ordinary skill in the art should understand that the technical solutions described in the foregoing embodiments can be modified, or some of the technical features can be equivalently replaced; these modifications or replacements do not depart from the essence of the corresponding technical solutions of the present invention. The spirit and scope of the technical solutions of the embodiments.