
Method for visualizing associated data through layer

A technology of associating data and data, applied in the field of data processing, can solve problems such as low efficiency, irregular drawing of charts, complicated operations, etc., and achieve the effect of saving time, realizing rapid classification and visual display, and simple and clear relationships

Active Publication Date: 2019-11-08
河南开合软件技术有限公司
View PDF6 Cites 10 Cited by
  • Summary
  • Abstract
  • Description
  • Claims
  • Application Information

AI Technical Summary

Problems solved by technology

[0004] The purpose of the present invention is to solve the problems of complex operation, non-standard chart drawing and low efficiency in the process of analyzing and visually displaying dialogue sheets, bills, whereabouts, and tax invoices through the existing data analysis method, and provides a A way to visualize linked data through layers

Method used


Image

  • Method for visualizing associated data through layer

Examples


Embodiment 1

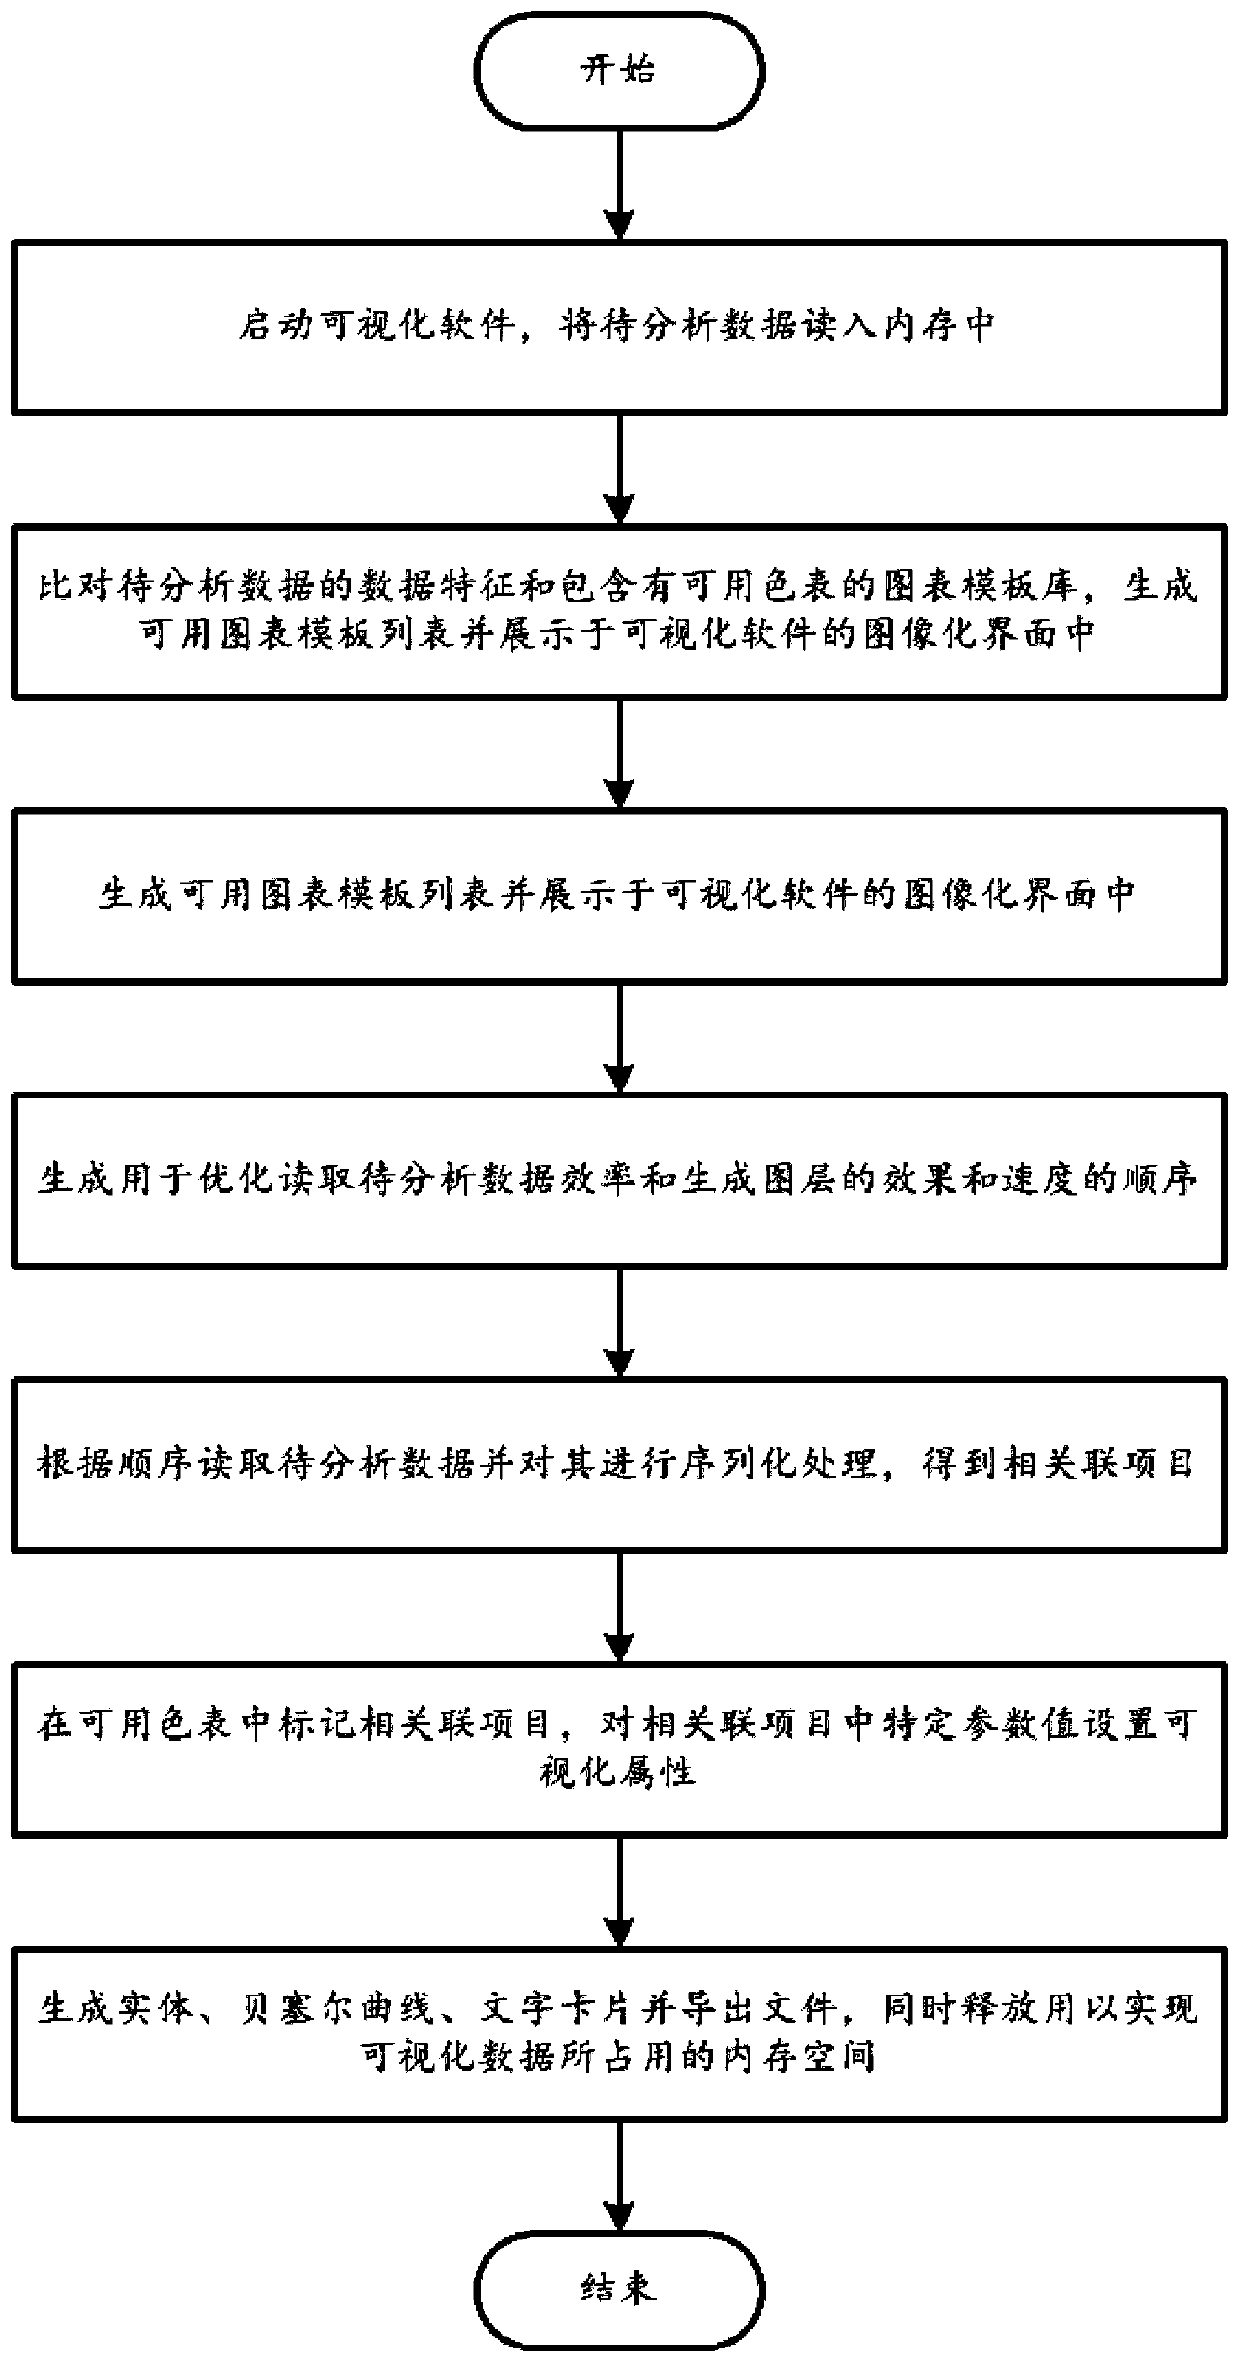
[0047] A preferred embodiment of the present invention provides a method for visualizing associated data through layers, using the database query interface or application program interface to obtain data and load it into the memory space, and then create interactive data display according to the type of chart task Interface, use divide and conquer algorithm, greedy algorithm, linear programming, optimize the order of chart generation, draw relational charts in batches in the form of animation and create corresponding mouse click and drag events, and write the sorted data in JSON or YAML format disk file. Such as figure 1 As shown, the method includes the following steps:

[0048] Step 1: Start the visualization software and read the data to be analyzed into the memory. Among them, visualization software includes:

[0049] The data cleaning module is used to read the data to be analyzed from the file containing the data to be analyzed and store it in the memory.

[0050] Th...


PUM


Abstract

The invention discloses a method for visualizing associated data through a layer, and relates to the technical field of data processing, which comprises the following steps of: 1, starting visualization software, and reading to-be-analyzed data into a memory; 2, comparing the data characteristics of the to-be-analyzed data with a chart template library containing available color charts in visualization software to generate an available chart template list, and displaying the available chart template list; 3, guiding a user to select a chart template as a data analysis chart from the availablechart template list, and creating a data display interface and a corresponding monitoring event; 4, generating a sequence for optimizing the efficiency of reading the to-be-analyzed data and the effect and speed of generating the layers, reading the to-be-analyzed data according to the generated sequence, and performing serialization processing on the to-be-analyzed data to obtain associated items; and 5, marking associated items in the available color table, setting visual attributes for specific parameter values in the associated items, generating corresponding entities, Bezier curves and character cards, exporting files, and releasing memory space.

Description

technical field [0001] The invention relates to the technical field of data processing, in particular to a method for visualizing associated data through layers. Background technique [0002] At present, after the bills, bills, whereabouts, tax invoices and other information collected by the public security organs, procuratorial organs, and disciplinary committees are analyzed and judged, document reports are generated with text descriptions as the main body. Due to the lengthy length and various formats of the electronic data in the clerical report, the content of the report is difficult to read and understand. [0003] Specifically, in document reports, statistical data generated using functions such as Excel pivot tables cannot intuitively reflect hierarchical relationships; it takes a lot of time to draw personnel relationships using the SmartArt drawing tool that comes with Word, and it is difficult to align them one by one, and it is difficult to maintain data consiste...

Claims


Application Information

Patent Timeline
Patent Type & Authority Applications(China)
IPC IPC(8): G06F16/248G06F16/242G06F16/215
CPCG06F16/248G06F16/2428G06F16/215
Inventor 王广峰王国俊吴东贤
Owner 河南开合软件技术有限公司
Learn More