
An automatic topology line loss analysis method based on the Internet of Things in the station area

An analysis method and topology line technology, applied in the direction of AC network circuits, sustainable buildings, instruments, etc., can solve the problems of lack of systematic standards, reduce enterprise work efficiency, and low precision, so as to reduce redundant work and realize line Loss calculation, the effect of improving work efficiency

Active Publication Date: 2021-03-23
SHANDONG ELECTRICAL ENG & EQUIP GRP +2
View PDF7 Cites 0 Cited by
  • Summary
  • Abstract
  • Description
  • Claims
  • Application Information

AI Technical Summary

Problems solved by technology

[0003] 1. There are many types of equipment in the low-voltage distribution area, and the large number leads to low efficiency of line loss analysis: the power supply department often needs to measure and calculate the equipment in the area one by one, although this can improve the accuracy of the analysis to a certain extent. However, this repetitive mechanical redundant work is not simple enough, which reduces the work efficiency of the enterprise
[0004] 2. The existing line loss analysis methods mostly use various simplified and approximate theories, such as the clustering method and regression method of load statistics, etc., but there are still low precision and inaccurate situations
[0005] 3. The existing methods for the screening and analysis of typical station areas lack systematic standards, are subjective, cumbersome, and inefficient, and are prone to errors and omissions. Comprehensive Analysis and Evaluation

Method used


Image

  • An automatic topology line loss analysis method based on the Internet of Things in the station area
  • An automatic topology line loss analysis method based on the Internet of Things in the station area
  • An automatic topology line loss analysis method based on the Internet of Things in the station area

Examples


Embodiment 1

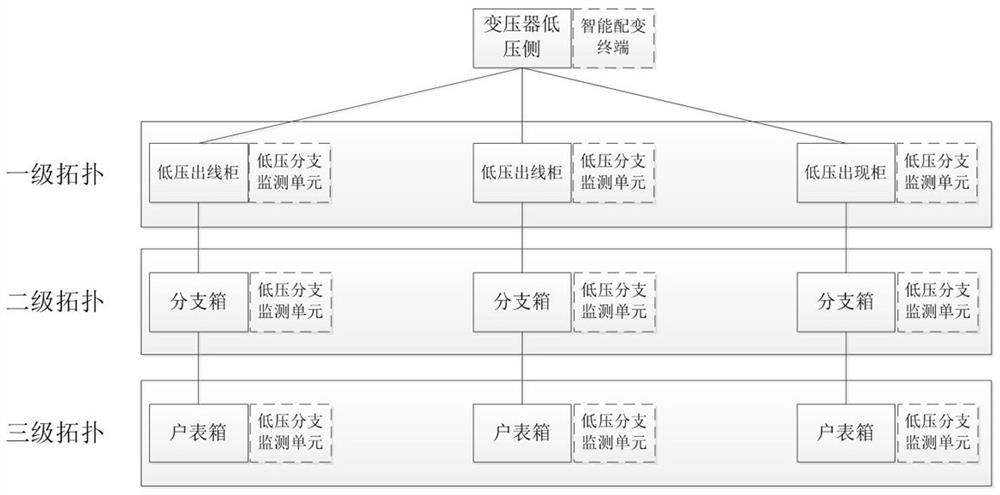
[0024] This embodiment discloses an automatic topology line loss analysis system based on the Internet of Things, such as figure 1 As shown, including intelligent distribution transformer terminal and low-voltage branch monitoring unit. The intelligent distribution transformer terminal is arranged on the low-voltage outgoing line side of the transformer in the power distribution room, and the low-voltage branch monitoring unit is installed at each branch of the low-voltage outgoing line cabinet, branch box, and household meter box in the station area. The low-voltage outgoing line cabinet belongs to the first-level topology, and the branch box belongs to In the second-level topology, the household meter box belongs to the third-level topology.

[0025] The intelligent distribution transformer terminal (TUU) includes a pulse signal transceiver unit, an electrical information collection unit, and an edge computing unit. The pulse signal transceiver unit can send and receive puls...

Embodiment 2

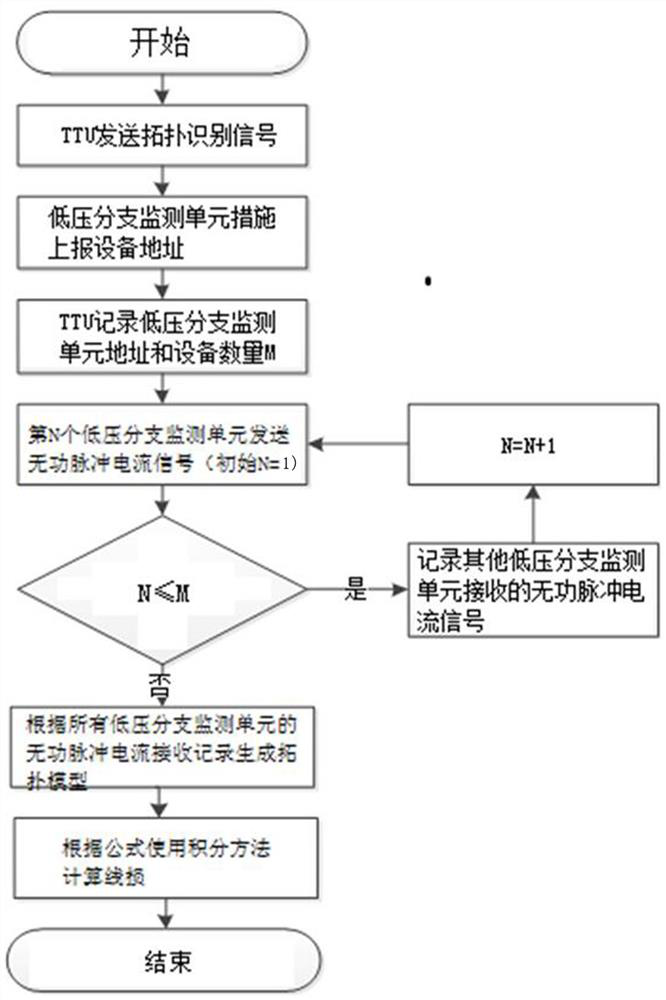
[0033] This embodiment discloses an automatic topology line loss analysis method based on the Internet of Things. This method is based on the system described in the embodiment, such as figure 2 shown, including the following steps:

[0034] S01), the TTU uses the broadband carrier technology to send the monitoring signal of the low-voltage branch monitoring unit through the CoAP protocol. After receiving the signal, the low-voltage branch monitoring unit successfully establishes communication with the TTU and registers the device;

[0035] S02), TTU counts the number of registered low-voltage branch monitoring units, a total of M, and marks them separately;

[0036] S03), the low-voltage branch monitoring units from No. 1 to No. M respectively send reactive pulse current signals sequentially. Other low-voltage branch monitoring units record according to whether they receive reactive pulse current signals;

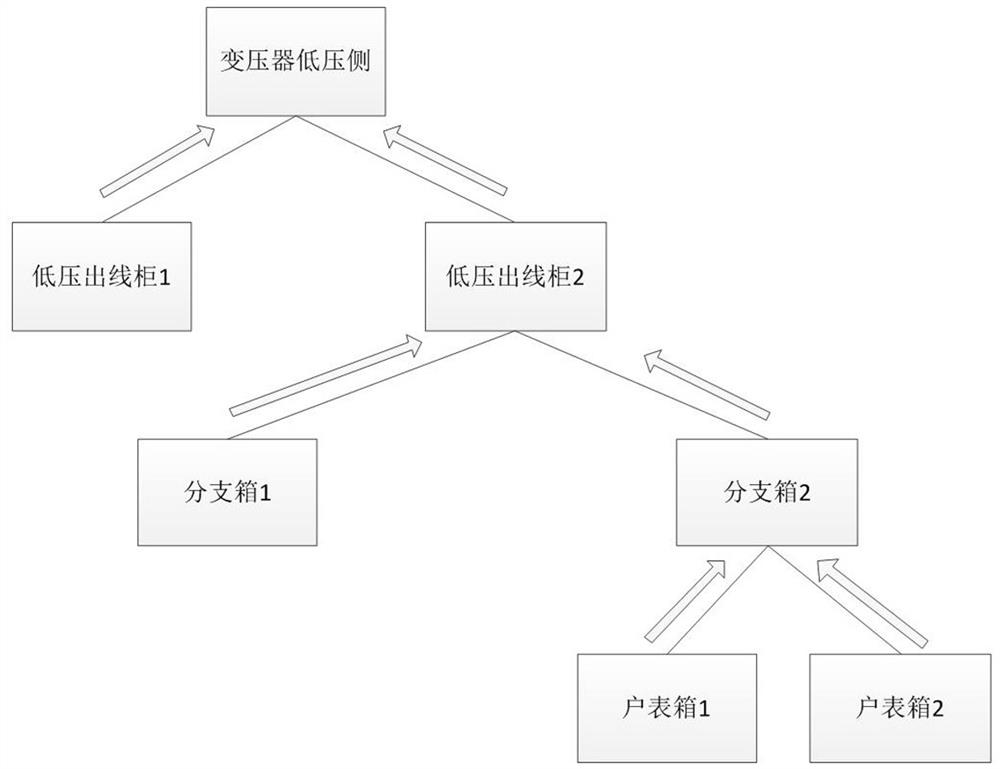
[0037] S04), the intelligent distribution transformer terminal dete...


PUM


Abstract

The invention discloses a transformer district automatic topology line loss analysis method based on the Internet of Things. The system comprises an intelligent distribution transformer terminal and alow-voltage branch detection unit, the intelligent distribution transformer terminal is disposed at a low-voltage outgoing line side of a transformer in a power distribution room, and the low-voltagebranch detection unit is disposed at each branch of a low-voltage outgoing line cabinet, a branch box and a household meter box in a transformer district, wherein the intelligent distribution transformer terminal comprises a pulse signal transceiving unit, an electrical information collection unit and an edge calculation unit, and the low-voltage branch detection unit comprises a pulse signal transceiving unit and an electrical information collection unit. The method comprises the following steps: determining a transformer area topological structure according to a reactive pulse current signal receiving record, generating a topological structure model, carding branch lines according to the topological structure model, collecting voltage and current information on the branch lines, and calculating a line loss value by utilizing an integral method. The internal topology of the transformer area can be automatically identified, and the line loss can be calculated in real time.

Description

technical field [0001] The invention relates to an automatic topology line loss analysis method for a station area based on the Internet of Things, belongs to the field of power distribution, and is used for analyzing line loss in a distribution station area. Background technique [0002] The distribution network is directly connected to the users, and the topology presents a tree shape, which has the characteristics of complex structure and large random load changes. Line loss is an important economic indicator of the power grid. The calculation of line loss in the distribution network is affected by the complexity of the distribution network topology and the dynamic load, and there are still the following problems: [0003] 1. There are many types of equipment in the low-voltage distribution area, and the large number leads to low efficiency of line loss analysis: the power supply department often needs to measure and calculate the equipment in the area one by one, althoug...

Claims


Application Information

Patent Timeline
Patent Type & Authority Patents(China)
IPC IPC(8): H02J3/00H02J13/00G01R31/00
CPCG01R31/00H02J3/00Y02B90/20Y04S40/128
Inventor 刘宗振张栋李军傅春明闫冠峰张猛李建颜世凯付志达王坤栾兰温胜
Owner SHANDONG ELECTRICAL ENG & EQUIP GRP
Learn More