Method for quantitatively detecting bisphenol A
A quantitative detection, bisphenol technology, applied in the field of environmental analytical chemistry, to achieve the effect of fast speed, simple method and good selectivity
- Summary
- Abstract
- Description
- Claims
- Application Information
AI Technical Summary
Benefits of technology
Problems solved by technology
Method used
Image
Examples
Embodiment 1
[0025] Graphene dispersion used in the present invention is purchased from Chengdu Institute of Organic Chemistry, Chinese Academy of Sciences, product number: TNWRGO, graphene thickness is 0.55 ~ 3.74nm, microchip size is about 0.5 ~ 3 μm, and total oxygen content is at 3% ~ 5%. about.
[0026] Add 15 μL of 0.4 wt% graphene dispersion to a 10 mL serum bottle, then add 100 μL of 6×10 -4 The rhodamine B aqueous solution of M was made to volume with Tris-HCl buffer solution with a pH value of 7.4, and the solution was left for 60 minutes before use. Graphene adsorbs rhodamine B to quench rhodamine fluorescence, and the fluorescence of the test system shows a "turn-off" state at this time.
Embodiment 2
[0028] Add 60 μL of 100 μM bisphenol A, phenol, hydroquinone, tribromophenol, m-aminophenol, 2,4,6-trinitrophenol to the solution prepared in Example 1, and the excitation wavelength is 554 nm The fluorescence of each sample was tested under the following conditions, and it was found that the fluorescence intensity of the sample added with bisphenol A increased significantly, and the fluorescence of the test system showed a "turn-on" state at this time. However, the fluorescence of other phenolic compound samples did not change significantly. At the same time, it can be seen with the naked eye that the solution color of the bisphenol A sample turns pink, while the color of other samples has no obvious change. It shows that the detection method has good selectivity to bisphenol A.
Embodiment 3
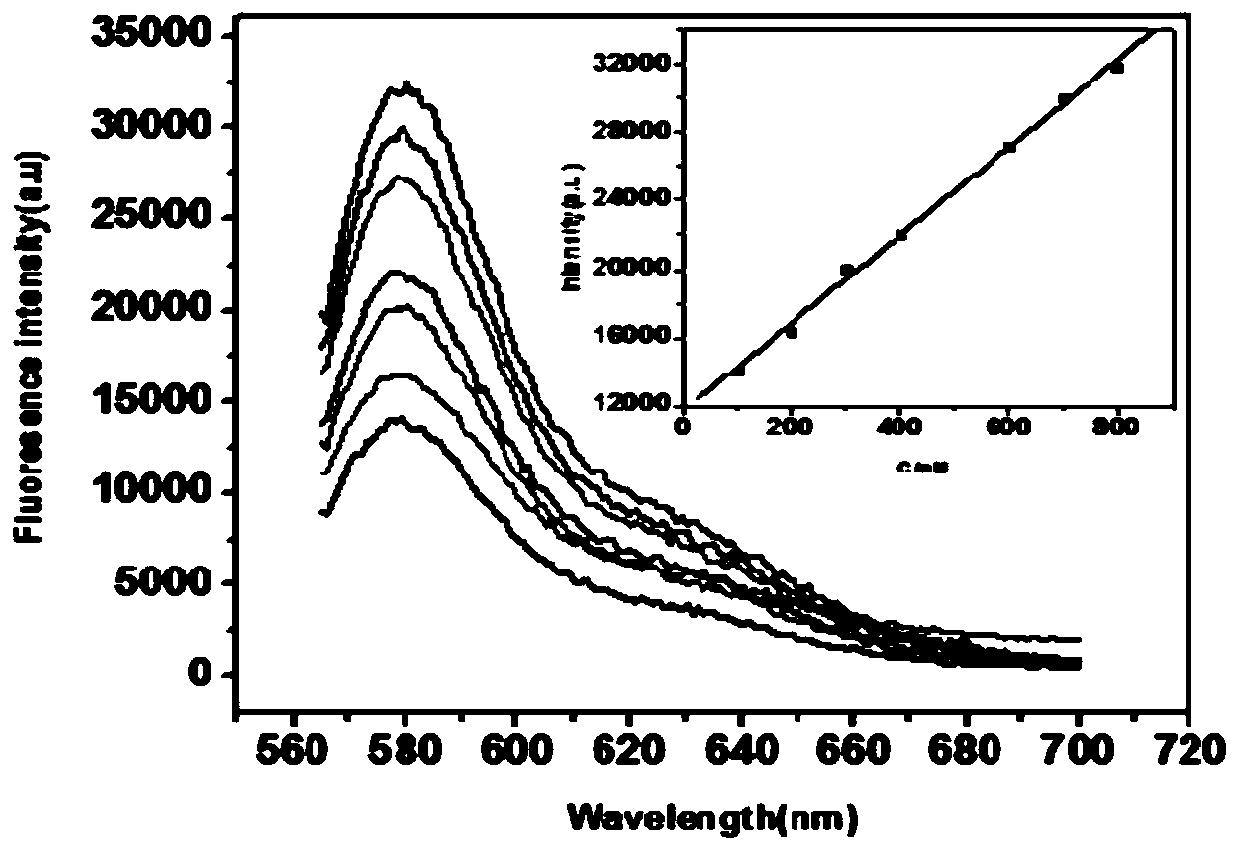
[0030] Add 10 μL, 20 μL, 30 μL, 40 μL, 60 μL, 70 μL, 80 μL of 100 μM bisphenol A to the solution prepared in Example 1, so that the final concentrations of bisphenol A in the sample are 100 nM, 200 nM, 300 nM, 400 nM, 600 nM, 700nM, 800nM, under the condition of excitation wavelength of 554 nm, the fluorescence spectrum was measured, and it was found that there was a linear relationship between the fluorescence intensity of the sample and the concentration of bisphenol A, and the linear range was 100-800 nM, see figure 1 . pass figure 1 Fluorescence emission spectra and linear ranges of the graphene-rhodamine system for different concentrations of bisphenol A (the corresponding bisphenol A concentrations from bottom to top of the spectral curve are: 100nM, 200nM, 300nM, 400nM, 600nM, 700nM, 800nM) , the bisphenol A concentration of the sample to be tested can be obtained.
PUM
| Property | Measurement | Unit |
|---|---|---|
| Thickness | aaaaa | aaaaa |
Abstract
Description
Claims
Application Information
 - R&D
- Intellectual Property
- Life Sciences
- Materials
- Tech Scout
- Unparalleled Data Quality
- Higher Quality Content
- 60% Fewer Hallucinations
Browse by: Latest US Patents, China's latest patents, Technical Efficacy Thesaurus, Application Domain, Technology Topic, Popular Technical Reports.
© 2025 PatSnap. All rights reserved.Legal|Privacy policy|Modern Slavery Act Transparency Statement|Sitemap|About US| Contact US: help@patsnap.com

