
Thrombus elasticity signal extraction method, storage medium and computer device

A technology for thromboelasticity and signal extraction, which is applied in material inspection products, measuring devices, instruments, etc., can solve the problems of high Q value, narrow band-pass filter bandwidth, easy to be interfered by noise, etc., and achieves easy processing and computational complexity. Improve, deal with good effect

Active Publication Date: 2020-09-22
SUZHOU INST OF BIOMEDICAL ENG & TECH CHINESE ACADEMY OF SCI +1
View PDF6 Cites 1 Cited by
  • Summary
  • Abstract
  • Description
  • Claims
  • Application Information

AI Technical Summary

Problems solved by technology

To achieve a sufficient signal-to-noise ratio, the bandwidth of the bandpass filter must be very narrow, and the Q value must be very high, which is often difficult to achieve in practice
The method of calculating the signal amplitude by simply finding the extreme value in the time domain is more susceptible to noise interference, and it is generally difficult to achieve better results

Method used


Image

  • Thrombus elasticity signal extraction method, storage medium and computer device
  • Thrombus elasticity signal extraction method, storage medium and computer device
  • Thrombus elasticity signal extraction method, storage medium and computer device

Examples


Embodiment 1

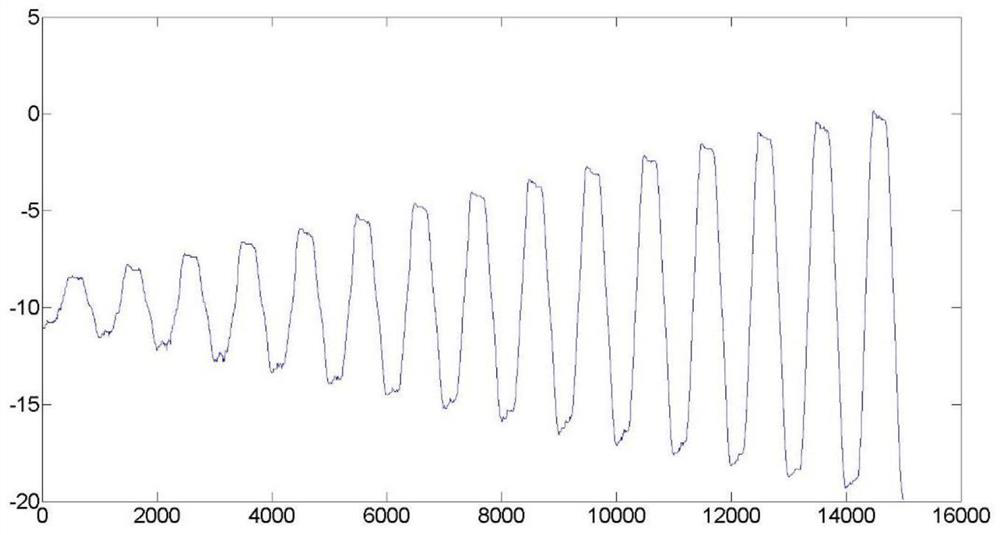
[0059] In this embodiment, in the thrombus elasticity measurement system, the oscillation period of the blood sample cup is 10s, and the oscillation angular displacement signal of the probe is sampled, the sampling time is the oscillation period of 10s, and the sampling rate is 100Hz. image 3 The sequence shown, the specific steps are:

[0060] 1. In each sampling time interval of 10s, the number of sampling data points of the angular displacement signal is 1000, and the sequence is obtained:

[0061] data_array[n],n=0,1,...999;

[0062] By using 1000 data in each sampling time, a value representing the thromboelasticity signal value in the oscillation cycle can be obtained.

[0063] 2. Generate radian sequence:

[0064] angle_array[n]=2π*n / 1000, n=1,2,...,999;

[0065] 3. Generate a sine sequence:

[0066] sin_array[n]=sin(angle_array[n]),n=0,1,...,999;

[0067] 4. Obtain the cosine sequence:

[0068] The cosine sequence is not generated separately, but the sine sequen...

Embodiment 2

[0097] Embodiment 2 increases single-frequency noise and white noise

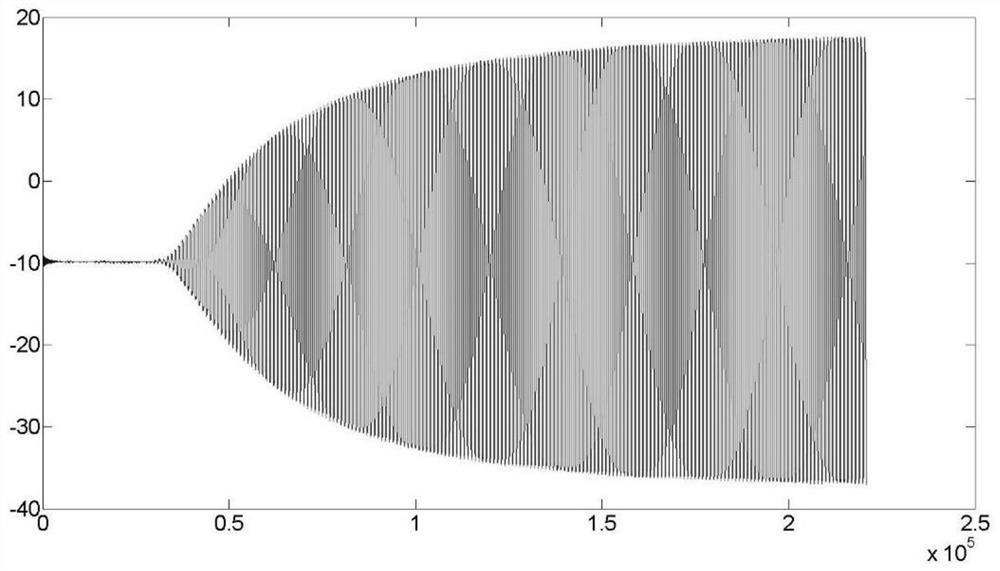
[0098] Superimpose the single-frequency noise and white noise of the non-blood cup oscillation period on the original sampling sequence, Figure 7 For the angular displacement signal plot with added noise, Figure 8 , Figure 9 is the local detail map of the signal ( Figure 8 and 9 The abscissa in represents the number of sampling points in an interval). Figure 10 for Figure 7 The thromboelastometry signal map obtained after the signal processing in , it can be seen that the added single-frequency noise and white noise have no obvious influence on the processing results.

Embodiment 3

[0099] Embodiment 3 increases the short-term impulse to simulate the vibration of the detection platform

[0100] The short-time impulse signal is added to the original sampling sequence to simulate the situation when the platform vibration is detected. Figure 11 For the angular displacement signal at this time, Figure 12 , Figure 13 is the local detail map ( Figure 12 and 13 The abscissa in represents the number of sampling points in an interval). Figure 14 for Figure 11 The thromboelastic signal diagram after the angular displacement signal processing shows that after adding the short-term impulse of the simulated vibration, the processing result has no obvious effect.


PUM


Abstract

The invention discloses a thrombus elasticity signal extraction method, a storage medium and computer device. The method comprises the following steps: performing data sampling on an angular displacement signal; generating an equal-difference radian sequence; generating sine and cosine sequences; respectively carrying out point multiplication on the sampling sequence and sine and cosine sequences,and solving an element average value; obtaining a thrombus elasticity signal in a single period; repeating the steps to obtain a thromboelastography signal in multiple periods, and generating a positive side signal sequence and a negative side signal sequence, so as to form a complete thromboelastography signal. According to the method provided by the invention, ideal sampling signals can be wellprocessed, and the method can suppress various noise components contained in the probe angular displacement signal of the equipment in the actual working process, such as the vibration signal of thedetection platform, the noise of the measurement system, the damped oscillation when the probe leaves the initial position, and the like, so as to obtain a more accurate thromboelastography signal.

Description

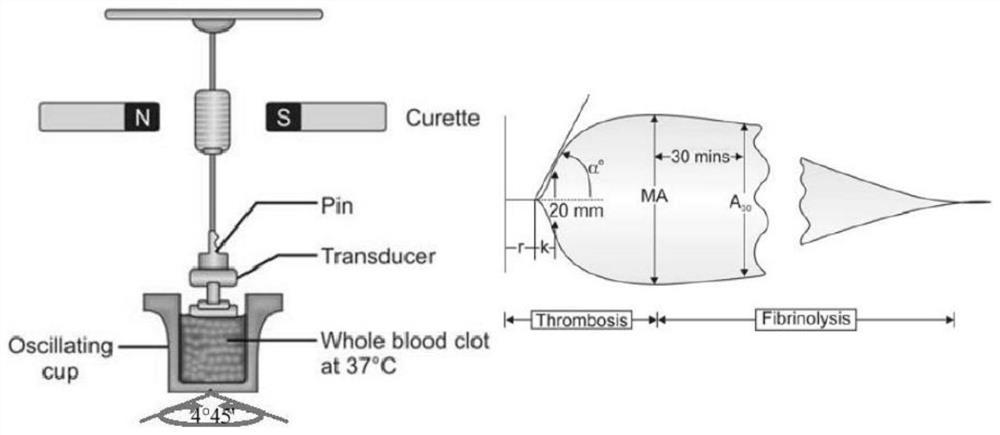
technical field [0001] The invention relates to the technical field of thrombus elasticity measurement, in particular to a method for extracting thrombus elasticity signals, a storage medium and computer equipment. Background technique [0002] During the coagulation process, fibrin, platelets and blood cells form a three-dimensional cross-linked network structure, blood viscoelasticity changes accordingly and is monitored by the thromboelasticity measurement system, and the thromboelastogram and a series of detection indicators are generated through data processing to qualitatively or quantitatively analyze the coagulation process . [0003] The principle of thromboelastometry is as follows: figure 1 : A special blood sample cup filled with blood, which reciprocates at a fixed angle and a fixed frequency around its central symmetry axis on the horizontal plane. A probe suspended by a wire is immersed in the blood sample. In the process of blood coagulation, the blood clo...

Claims


Application Information

Patent Timeline
IPC IPC(8): G01N33/49
CPCG01N33/4905
Inventor 钱俊孙海旋李俊坡梁伟国王弼陡杨维闫雪松王钟周
Owner SUZHOU INST OF BIOMEDICAL ENG & TECH CHINESE ACADEMY OF SCI
Learn More