System for dynamic power grid pollution area graph and intelligent sensing method

A polluted area and dynamic technology, applied in signal transmission system, image data processing, 2D image generation, etc., can solve the problems of low accuracy, large difference, and low data accuracy, and achieve improved accuracy, improved precision, The effect of high degree of intelligence

Pending Publication Date: 2020-12-29
ELECTRIC POWER RESEARCH INSTITUTE OF STATE GRID SHANDONG ELECTRIC POWER COMPANY +2
View PDF2 Cites 0 Cited by
  • Summary
  • Abstract
  • Description
  • Claims
  • Application Information

AI Technical Summary

Problems solved by technology

[0003] There are many problems in the drawing method of the above-mentioned grid pollution area map: 1. The measurement of pollution information is based on the experience of personnel, the human subjectivity is large, and the accuracy of the data is low; The period is too long, so the impact of environmental changes on the degree of pollution cannot be reflected in time; 3. The polluted area map is inconvenient to use, and the support for external insulation configuration and pollution flashover accident prevention and control of the power grid is limited, which affects the safety of power grid operation
[0004] The pollution on-line detection technology and "electronic pollution area map" developed in the early stage can realize pollution on-line monitoring and pollution area display, and can be applied in local areas, but the optical fiber monitoring process is indirectly represented by quartz rods, and the drawing of electronic pollution area maps depends on the cumulative The fitting calculation of the data and the measured data is quite different from the actual situation; the "leakage current method" is affected by various factors such as voltage, structure, humidity, pollution distribution and composition, and the dispersion of each parameter is strong, and the output results are valid. The reliability is debatable, and the ability to prevent pollution flashover accidents is limited, so it is not suitable as a data source for pollution area maps

Method used


Image

  • System for dynamic power grid pollution area graph and intelligent sensing method

Examples


Embodiment Construction

[0047] In order to make the purpose, technical solutions and advantages of the embodiments of the present invention more clear, the following will clearly and completely describe the technical solutions of the embodiments of the present invention in conjunction with the drawings of the embodiments of the present invention. Apparently, the described embodiments are some, not all, embodiments of the present invention. All other embodiments obtained by those skilled in the art based on the described embodiments of the present invention belong to the protection scope of the present invention.

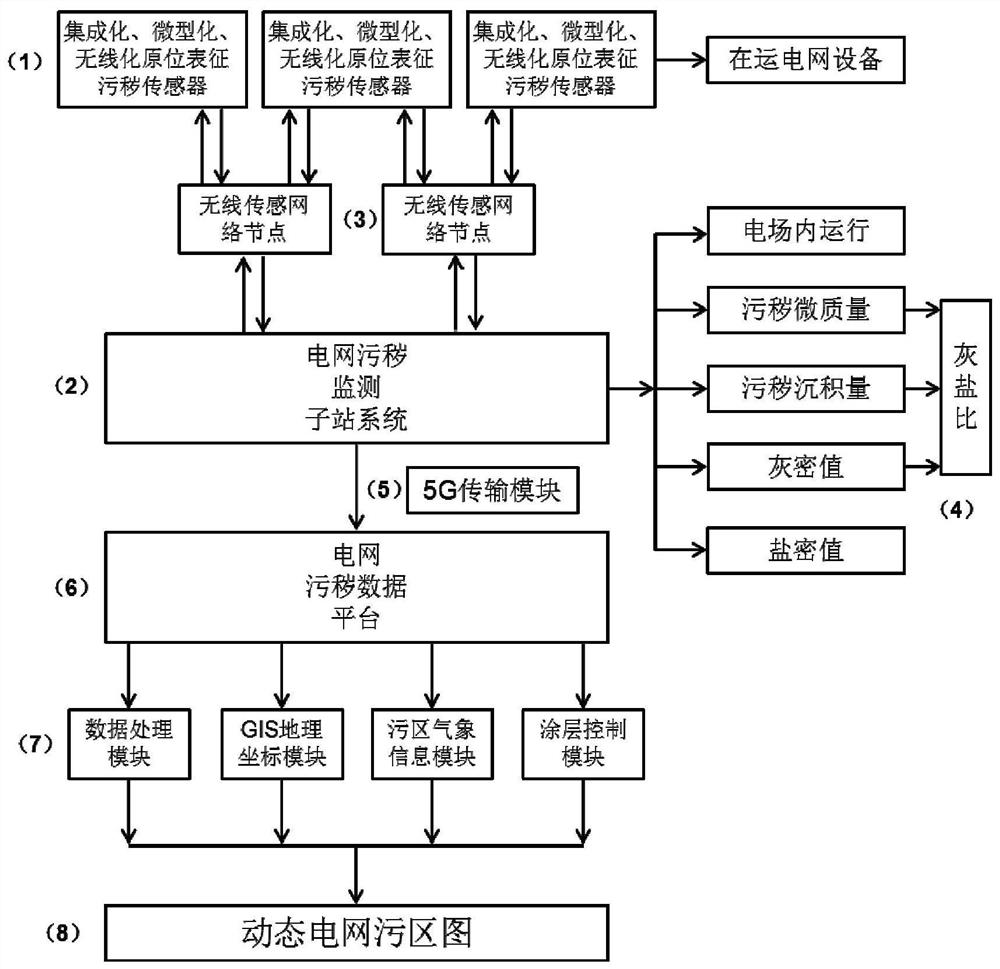
[0048] Such as figure 1 As shown, the dynamic pollution map system of the present invention includes:

[0049] Integrated, miniaturized, and wireless in-situ pollution sensor system 1 attached to the surface of power grid equipment;

[0050] Power grid pollution monitoring sub-station system 2 installed in the electric field, integrating micro-mass and gray-salt ratio monitoring modules, ...


PUM


Abstract

The invention provides a system for a dynamic power grid pollution area diagram and an intelligent sensing method, and the system comprises a pollution in-situ representation micro-sensor system integrated with a micro-mass / ash-salt ratio monitoring module, a wireless sensor network node module and a 5G data transmission module. A data platform system which is internally provided with a database server or a cloud website and is provided with drawing software for the dynamic power grid pollution area graph is utilized. According to micro-mass or the total deposition amount collected by a sensorsystem and a micro-mass value, the ash density value and the salt density value collected by a monitoring substation system. A dust density value and a salt density value of the data is calculated bythe sensor system, various data is comprehensively analyzed and processed, and the dynamic pollution area graph is drawn. Systematic, comprehensive, accurate and direct measurement and drawing technology is provided for drawing of a power grid pollution area graph, the method is closer to the actual state of pollution and the actual state of a pollution area, and reliable and scientific support and basis can be provided for various plans and decisions of a power grid.

Description

technical field [0001] The invention belongs to the field of intelligent sensing of grid pollution, and in particular relates to a dynamic grid polluted area map system and an intelligent sensing method. Background technique [0002] The power grid pollution area map is a special reference map for the external insulation strength of the power grid affected by natural pollution and industrial pollution, and is an important basis for the external insulation configuration of the power system and the prevention and control of pollution flashover accidents. The current standards for drawing pollution area maps mainly rely on manual measurements on reference insulators. By means of climbing sampling, cleaning and wiping, conductivity testing and filter weighing, etc., the equivalent salt density value, gray density value and pollution degree are calculated and obtained. Power grid personnel unify, organize, and summarize the data, and then draw the geographical map of the transmi...

Claims


Application Information

Patent Timeline
Patent Type & Authority Applications(China)
IPC IPC(8): G06Q50/06G06F16/29G01D21/02G06T11/20G08C17/02
CPCG06Q50/06G06F16/29G01D21/02G06T11/206G08C17/02
Inventor 郭凯姜波李辛庚石岩王晓明吴亚平田双米春旭高智悦宗立君姚硕
Owner ELECTRIC POWER RESEARCH INSTITUTE OF STATE GRID SHANDONG ELECTRIC POWER COMPANY
Why Eureka
Try Eureka