A Time-Frequency Difference Estimation Method for Time-Frequency Aliasing Signals

A technology of aliasing signals and time-frequency difference, applied in transmission systems, baseband system components, electrical components, etc., can solve the problem of reducing the amount of calculation, the fourth-order maximum likelihood algorithm has a large amount of calculation, and the separation and positioning of non-aliasing signals, etc. problem, to achieve the effect of improving the estimation accuracy

Active Publication Date: 2021-12-24
XIDIAN UNIV +1
View PDF6 Cites 0 Cited by
  • Summary
  • Abstract
  • Description
  • Claims
  • Application Information

AI Technical Summary

Problems solved by technology

[0004] The second-order cross ambiguity function (Cross Ambiguity Function, CAF), as a classic time-frequency difference joint estimation algorithm, has the advantage of accurately estimating TDOA when FDOA has not been corrected, and the operation speed is relatively fast; while high-order Under the premise of increasing the amount of computation and sacrificing the speed of computation, the mutual ambiguity function of the method achieves a more accurate estimation than the second-order mutual ambiguity function; another commonly used method, the fourth-order maximum likelihood algorithm (Maximum Likelihood, ML) in The above-mentioned various algorithms can achieve the maximum estimation accuracy, but the fourth-order maximum likelihood algorithm has a huge amount of calculation, and some means are needed to reduce the amount of calculation; however, all the above-mentioned functions do not satisfy the linear additive relationship, and cannot be used for aliasing Separation and localization of signals

Method used


Image

  • A Time-Frequency Difference Estimation Method for Time-Frequency Aliasing Signals
  • A Time-Frequency Difference Estimation Method for Time-Frequency Aliasing Signals
  • A Time-Frequency Difference Estimation Method for Time-Frequency Aliasing Signals

Examples


Embodiment 1

[0067] The frequency domain cross-correlation algorithm described in the step S1 is derived from the fourth-order maximum likelihood algorithm. The fourth-order maximum likelihood algorithm is expressed as:

[0068]

[0069] Among them, X 1 is the result of discrete Fourier transform on the first signal, X 2 (τ, υ) is the result of performing discrete Fourier transform on the signal after the time delay τ and frequency offset υ of the second channel signal. Different values ​​of τ and υ are used to obtain different values ​​of the fourth-order maximum likelihood function. Among them, the τ value and υ value corresponding to the largest fourth-order maximum likelihood function value are the estimated values ​​of TDOA and FDOA;

[0070] The frequency-domain cross-correlation algorithm is simplified from the fourth-order maximum likelihood algorithm, and the frequency-domain cross-correlation algorithm described in the step S1 is expressed as:

[0071]

[0072] Among th...

Embodiment 2

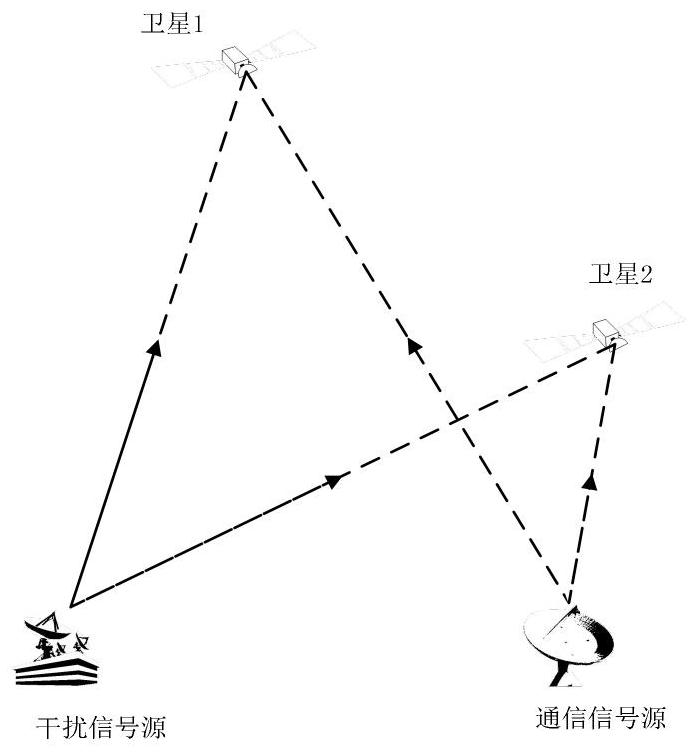
[0081] refer to figure 1The aliasing scenario of the communication signal and the interfering signal is shown. Both satellite 1 and satellite 2 received aliased signals from the communication station and the jamming station. Assume that the signal transmitted by the communication signal source is s 1 (t), the signal emitted by the interference signal source is s 2 (t), then the signals received by the two satellites can be modeled as

[0082]

[0083]

[0084] In the formula, ω 1 (t) and ω 2 (t) represents Gaussian white noise received by two satellites, a 11 、a 21 、a 12 and a 22 Both are the amount of signal fading, τ 11 , τ 21 , τ 12 and τ 22 is the time delay, ν 11 、ν 21 、ν 12 and ν 22 is the frequency shift.

[0085] The true value of the time difference Δτ of the communication signal 1 Sum frequency difference true value Δν 1 , the true value of time difference Δτ of the interference signal 2 Sum frequency difference true value Δν 2 for

[0086...

Embodiment 3

[0124] The method for obtaining the peak-to-average ratio of the interference signal correlation peak in the step S4 is as follows:

[0125] Set the equivalent fading of the communication signal as That is, the amount of fading from the communication signal to the two satellites is Then the cross-correlation function of the communication signal becomes:

[0126]

[0127] The correlation function of the aliased signal minus the correlation function of the communication signal is

[0128]

[0129] As shown in the above formula, there is The component of , only the autocorrelation component of the communication signal is completely removed, that is In the case of , the estimated value of TDOA and FDOA of the interference signal can be further improved;

[0130] In order to remove the correlation component of the communication signal more thoroughly, we can introduce the peak-to-average ratio λ, which is the peak / average value of the correlation peak. When λ reaches ...


PUM


Abstract

The invention discloses a method for estimating time-frequency difference of a time-frequency aliasing signal, which relates to the technical field of electronic reconnaissance. The frequency-domain cross-correlation operation is performed on an input signal to obtain a correlation function; Domain cross-correlation operation to find the correlation function of the communication signal; subtract the correlation function of the communication signal from the correlation function of the aliasing signal to obtain the correlation function of the interference signal; change the amplitude of the correlation function of the communication signal to calculate the peak of the correlation peak of the interference signal The TDOA and FDOA values ​​of the interference signal can be estimated by taking the maximum peak-to-average ratio. The present invention constructs the time difference-frequency difference maximum likelihood estimation model of aliasing signals, and adopts the method of linear subtraction to remove the correlation peak of one of the signals, thereby obtaining the correlation peak of the other signal, and according to the peak-to-average ratio of the final correlation peak , to estimate the peak value of one signal, and then obtain the global maximum value of the other signal, which is the estimated time difference-frequency difference.

Description

technical field [0001] The invention relates to the technical field of electronic reconnaissance, in particular to a method for estimating time-frequency difference of a time-frequency aliasing signal. Background technique [0002] Passive positioning, as one of the main means of spaceborne positioning, plays an increasingly important role in extreme situations such as battlefield environments and natural disasters. The main means of passive passive positioning is time-frequency difference joint positioning. The two important parameters used in it are the estimation accuracy of time difference of arrival (Time Different Of Arrival, TDOA) and frequency difference of arrival (FDOA). It directly affects the positioning accuracy. Therefore, a high-precision time-frequency difference estimation algorithm is indispensable for improving positioning accuracy. [0003] When our side conducts normal satellite communication, it is often interfered with by the enemy's jamming signal o...

Claims


Application Information

Patent Timeline
Patent Type & Authority Patents(China)
IPC IPC(8): H04B1/713H04B1/715H04L25/02
Inventor 马骁郝本建杨政王汉严少虎
Owner XIDIAN UNIV
Why Eureka
Try Eureka