Big data visualization method and system

A big data and data technology, applied in the field of big data visualization methods and systems, can solve the problem of reducing the user's operating experience, lack of data-based thinking in big data control screen display software, and poor expansion of targeted business scenarios in the industry of big data visualization methods. problems to improve the user experience

Pending Publication Date: 2021-04-30
EAST CHINA NORMAL UNIV
View PDF11 Cites 0 Cited by
  • Summary
  • Abstract
  • Description
  • Claims
  • Application Information

AI Technical Summary

Problems solved by technology

[0004] And because the big data visualization method is highly targeted in the industry and has poor business scenario expansion, the existing big data control screen display software lacks data-based thinking, which seriously reduces the user's sense of operating experience.

Method used


Image

  • Big data visualization method and system
  • Big data visualization method and system
  • Big data visualization method and system

Examples


Embodiment Construction

[0014] The specific implementation manners of the present invention will be further described in detail below in conjunction with the accompanying drawings.

[0015] The present invention aims to focus on the algorithm-first mode with higher flexibility and greater extensibility. In the way of semi-self-service drawing and editing, after the user transmits the data source, the content and visualization method of the target configuration chart can be formulated according to their own needs. Generate user-specific configuration documents without customization and not limited by business scenarios, solving the problems of existing big data visualization that require customization and low user experience.

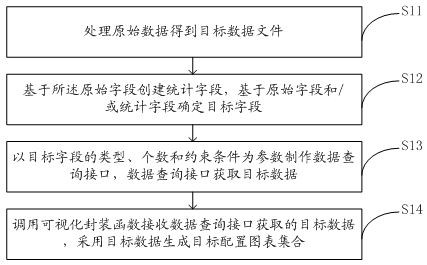
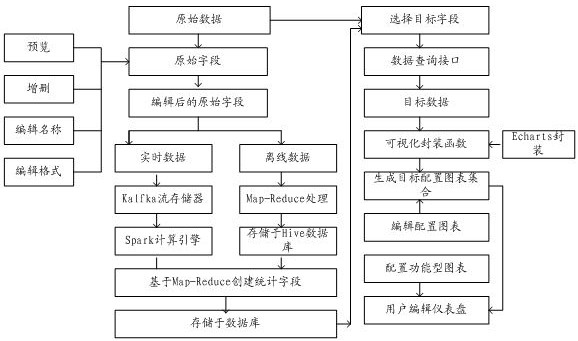
[0016] combine figure 1 with image 3 As shown, the big data visualization method proposed by the present invention includes the following steps:

[0017] Step S11: Process the original data to obtain the target data file.

[0018] Sources of raw data include data files uplo...


PUM


Abstract

The invention discloses a big data visualization method and system, and the method comprises the steps of firstly processing original data to obtain a target data file containing an original field, then building a statistical field based on the original field, and determining a target field based on the original field and/or the statistical field; making a data query interface by taking the type, the number and the constraint condition of the target field as parameters, acquiring target data from the database by the data query interface and transmitting the target data to a visual encapsulation function, and generating a target configuration chart by the visual encapsulation function by adopting the target data for combination; through a semi-self-service drawing and editing algorithm, after a user transmits a data source, forming a required target statistical field according to requirements, forming a configuration icon set according to the target statistical field, and realizing a graphic operable target configuration chart set on the basis of packaging of visual scripts, so that the problems that existing big data visualization needs to be customized and the user experience is low can be solved.

Description

technical field [0001] The invention belongs to the technical field of big data processing, and in particular relates to a big data visualization method and system. Background technique [0002] In the context of the rapid development of big data, the total amount of global data will reach 40ZB in 2020; the compound growth rate of China's big data industry in the next five years will be about 27.29%. More than 80% of the information obtained by humans comes from the visual system, and the huge and rapidly increasing amount of data puts forward higher requirements for the visualization of the end of big data. [0003] At present, big data visualization is mainly used in many industries such as manufacturing and natural resources, retail and sales trade, transportation, banking and securities, communication media entertainment, medical care, education, government and insurance, especially the financial and Internet industries; In the industry, the realization of big data visu...

Claims


Application Information

Patent Timeline
Patent Type & Authority Applications(China)
IPC IPC(8): G06F16/2458G06F16/26G06F16/28
CPCG06F16/2462G06F16/2465G06F16/26G06F16/283
Inventor 张红刘承良陈豪杰蓝天
Owner EAST CHINA NORMAL UNIV
Why Eureka
Try Eureka