
List and Gantt chart bidirectional influence method

A technology of representation and identity, applied in the field of bidirectional influence of lists and Gantt charts, can solve problems such as high operating costs, weak desire to use, and complex relationships, and achieve the effect of reducing operating costs and solving chaotic hierarchical relationships.

Pending Publication Date: 2021-05-07
河南省城乡规划设计研究总院股份有限公司
View PDF0 Cites 1 Cited by
  • Summary
  • Abstract
  • Description
  • Claims
  • Application Information

AI Technical Summary

Problems solved by technology

However, the system for dividing task levels in the current project management software is cumbersome to operate, has complex relationships, and has low visibility
[0005] There are two disadvantages of the existing software method: 1. The problem of high operation cost caused by one-way modification of operation logic; 2. The problem of weak desire to use and high operation cost caused by low degree of visualization

Method used


Image

  • List and Gantt chart bidirectional influence method
  • List and Gantt chart bidirectional influence method
  • List and Gantt chart bidirectional influence method

Examples


Embodiment 1

[0041] Example 1: Linkage effects of editing task details

[0042] Step 1: The user opens the list module of the software to view the detailed information of each task.

[0043] Technology 1: The client sends an instruction to obtain project data to the server through JavaScript operations, and the server obtains project data from the background database and renders it on the web (browser) page through html, CSS, JavaScript and other technologies.

[0044] Step 2: The user modifies and edits task data in the list view.

[0045] Technology 2: The client sends an instruction to modify task data to the server through JavaScript operations and transmits the edited project information data. After the server processes the project information data, it transmits and saves it to the database.

[0046] Step 3: The user visits the Gantt chart module to view project task information.

[0047] Technology 3: The client sends an instruction to obtain project data to the server, and obtains...

Embodiment 2

[0049] Example 2: Linkage impact of modification of task time

[0050] With embodiment 1.

[0051] On the client side, the user adjusts the task time by dragging the task bar in the Gantt chart module. The client receives this operation instruction and processes it on the server and then transmits it to the database. The background database will save the modified task time data; the user When opening the list module, the client obtains the updated data in the server through the network, and displays it in the list module in the form of text information.

[0052] Similarly, when the user edits the task time in the list module on the browser, the modification instruction and related information are processed by the server and transmitted to the background database, and the information in the background database is modified. When the user opens the Gantt chart module again, he will see the modified task time information recorded in the background processing displayed on the Gant...

Embodiment 3

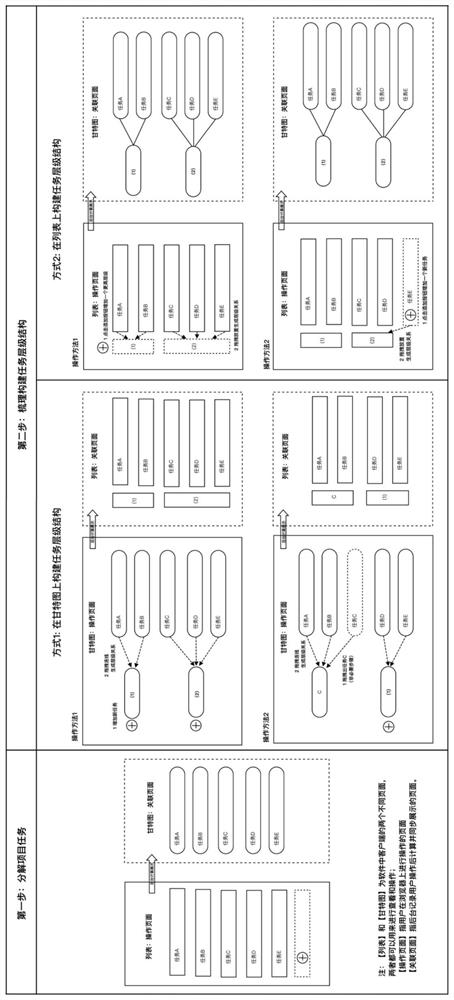
[0053] Example 3: Linkage impact of task hierarchy division


PUM


Abstract

The invention discloses a list and Gantt chart bidirectional influence method, wherein the list and the Gantt chart are both used for representing management planning of the same task; the information of the task is stored in a database; the method comprises the following steps: establishing a relation between the list and the database and a relation between the Gantt chart and the information of the task in the database, so that the user can know the information of the task through the observation list and / or the Gantt chart; and receiving a first task data modification instruction from the page where the Gantt chart is located, processing the first task data modification instruction, and correspondingly updating the information of the task in the database. A problem that when project management software is used, a user needs to switch various different view pages back and forth for related operation is solved; meanwhile, the operation cost for project management personnel to create and sort task relationships is reduced, the problem that task decomposition hierarchical relationships are disordered is solved, and project management work becomes simple and clear due to high visualization.

Description

technical field [0001] The invention belongs to the technical field of data visualization, and in particular relates to a method for bidirectional influence of a list and a Gantt chart. Background technique [0002] A project management system is software used by project managers to manage projects. The project management system enables project managers to control various resources involved in the project, and finally achieve project goals through organization, planning, execution, monitoring and other links. With the development of Internet technology, project management software has gradually become an indispensable management tool for project managers. [0003] The information of a project can be displayed in various forms in the software, and the Gantt chart is one of the important forms. However, the existing project management software uses the Gantt chart as a terminal interface for displaying information, and cannot perform in-depth operations on the Gantt chart, a...

Claims


Application Information

Patent Timeline
IPC IPC(8): G06Q10/10G06F16/23G06F16/28G06F16/903G06F16/904
CPCG06Q10/103G06F16/23G06F16/284G06F16/903G06F16/904
Inventor 杨磊
Owner 河南省城乡规划设计研究总院股份有限公司
Learn More