Overall visual analysis method for safety monitoring data

A technology for security monitoring and analysis methods, applied in data processing applications, electrical digital data processing, special data processing applications, etc. Get the effect of improving readability

Active Publication Date: 2021-05-14
国家能源集团新疆吉林台水电开发有限公司 +1
View PDF3 Cites 0 Cited by
  • Summary
  • Abstract
  • Description
  • Claims
  • Application Information

AI Technical Summary

Problems solved by technology

[0011] The present invention provides an overall visual analysis method of safety monitoring data, which is used to solve the problem that the data displayed by the professional map in the prior art is difficult to understand, which is not conducive to the understanding of non-professionals, and also saves manual integration of measuring point information and comparative analysis result time

Method used


Image

  • Overall visual analysis method for safety monitoring data
  • Overall visual analysis method for safety monitoring data
  • Overall visual analysis method for safety monitoring data

Examples


Embodiment Construction

[0044] In order to make the purpose, technical solutions and advantages of the embodiments of the present invention clearer, the technical solutions in the embodiments of the present invention will be clearly and completely described below in conjunction with the drawings in the embodiments of the present invention. Obviously, the described embodiments It is a part of embodiments of the present invention, but not all embodiments. Based on the embodiments of the present invention, all other embodiments obtained by persons of ordinary skill in the art without making creative efforts belong to the protection scope of the present invention.

[0045] The present application is described in detail in conjunction with specific embodiments:

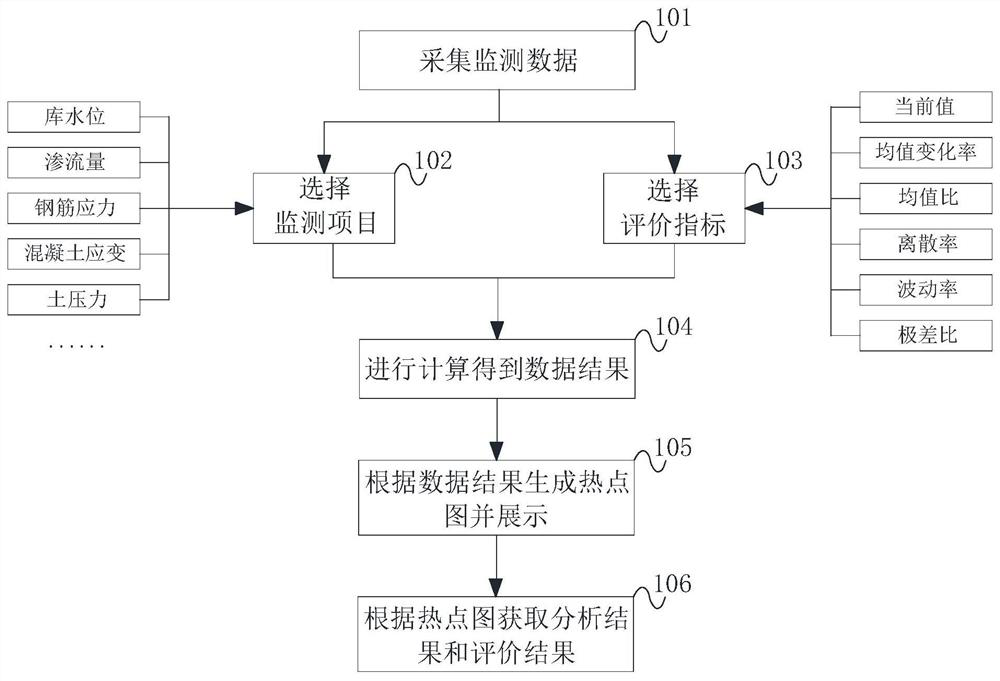
[0046] First, a preliminary description is given, such as figure 1 as shown, figure 1 A flow chart of an overall visual analysis method for safety monitoring data provided by an embodiment of the present invention:

[0047] Step 101, collectin...


PUM


Abstract

The invention provides an overall visual analysis method for the safety monitoring data according to the technical scheme; by selecting different evaluation indexes, calculation, comparison and analysis are carried out aiming at the measured value data of a plurality of monitoring points of various types of monitoring items in an engineering structure; an analysis result is vividly displayed in a measuring point distribution scene in the form of a hotspot map, and the current state of a plurality of measuring points of a certain monitoring type and the change condition of each time period are visually displayed by using hotspot icons (represented by a circle taking a corresponding monitoring point as the center) with different colors and different intensities; meanwhile, by application of statistical analysis of data, tthe analysis depth of monitoring data is increased. Mass monitoring data are managed by adopting an information technology, and the monitoring data and an analysis result thereof are displayed in a visual manner, so that the safety monitoring work is more efficient and professional.

Description

technical field [0001] The invention relates to the field of safety monitoring, in particular to an overall visual analysis method of safety monitoring data. Background technique [0002] In recent years, with the rapid development of information technologies such as the Internet, cloud computing, and the Internet of Things, the entire world has entered the era of big data, and the massive amounts of data generated by various industries are unprecedented. Processing massive data, mining information, and conveying the value of its existence through reasonable expressions are what everyone is currently doing. [0003] In the field of automated safety monitoring, building structures are usually complex, and there are many types of sensors and hot spots for structural monitoring; as the service life of monitoring instruments increases, the volume of monitoring data becomes larger and the structure of various types of monitoring data is complex. Managers often need a lot of time...

Claims


Application Information

Patent Timeline
Patent Type & Authority Applications(China)
IPC IPC(8): G06F30/20G06Q10/06G06Q10/10G06Q50/08G06Q50/26G06F113/08G06F119/14
CPCG06F30/20G06Q10/06393G06Q10/103G06Q50/08G06Q50/265G06F2119/14G06F2113/08Y02A10/40
Inventor 杨国华高闻李楠楠陈智梁李小虎
Owner 国家能源集团新疆吉林台水电开发有限公司
Why Eureka
Try Eureka