
Bridge construction monitoring visualization system based on Revit software

A bridge construction and software technology, applied in the field of construction industry information, can solve the problems of information loss, poor combination of visualization methods, and underutilization of the 3D visualization environment.

Pending Publication Date: 2020-10-30
NANJING FORESTRY UNIV
View PDF0 Cites 1 Cited by
  • Summary
  • Abstract
  • Description
  • Claims
  • Application Information

AI Technical Summary

Problems solved by technology

Wang Chao from Harbin Institute of Technology took Revit as the core software platform, used C# programming language and Revit API, developed a structural monitoring information management plug-in based on Revit+SQL Server framework, and realized the visualization of monitoring information based on Revit. The combination of BIM software platform is not strong, the visualization of monitoring data is basically obtained through simple 2D charts, and the 3D visualization environment provided by Revit is not fully utilized; Xu Zhao et al. from Southeast University proposed a BIM model that combines WebGL and IFC standards The visual analysis method uses WebGL technology to expand the 3D visual display method of the BIM model, so that the BIM model can obtain the visual expression mode supported by the .html and .js formats. However, the technology is not yet mature. After the IFC conversion, the information loss is serious. How to realize the complete analysis of the IFC file information by WebGL still needs further research; JM Davila Delgado proposed the method of using the game engine framework Unity3D to develop independent The powerful 3D image rendering, interactive module and network module of the engine can process time series data (monitoring data) in an interactive way in 3D scenes, and make real-time data visualization possible, but the development volume is large and time-consuming. Not preferred for research purposes

Method used


Image

  • Bridge construction monitoring visualization system based on Revit software
  • Bridge construction monitoring visualization system based on Revit software
  • Bridge construction monitoring visualization system based on Revit software

Examples


Embodiment Construction

[0031] The technical solutions in the embodiments of the present invention will be further described below in conjunction with the drawings in the embodiments of the present invention. However, the invention is not limited to the best embodiments presented.

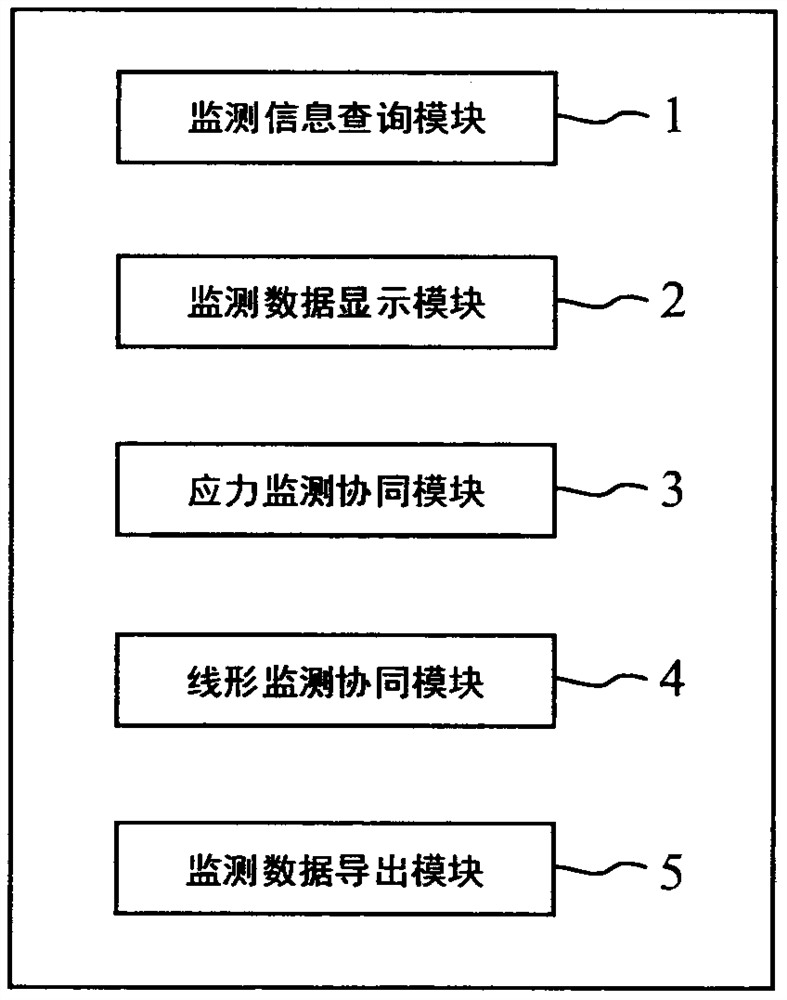
[0032] Such as figure 1 As shown, this example chooses to develop Revit software based on the .NET Framework 4.5.2 platform, adopts the C# programming language, and uses the programming software Visual Studio 2017 for secondary development programming, providing a bridge construction monitoring visualization system based on Revit software , the system includes the following modules:

[0033] Monitoring information query module 1, used to provide query of sensor test data and measured data of main girder section elevation;

[0034] The monitoring data display module 2 is used to provide chart visualization of bridge construction monitoring data;

[0035] The stress monitoring collaborative module 3 is used to directly d...


PUM


Abstract

The invention relates to a bridge construction monitoring visualization system based on Revit software, and the bridge construction monitoring visualization system comprises a monitoring information query module which is used for providing query of sensor test data and main beam segment elevation actual measurement data; a monitoring data display module which is used for providing chart visualization for the bridge construction monitoring data; a stress monitoring cooperation module which is used for directly displaying error states of actually measured stress and theoretical stress of the sensor in different construction stages and under different construction working conditions in the BIM; a linear monitoring cooperation module which is used for generating a main beam BIM model consistent with the actual construction line shape in different construction stages; and a monitoring data exporting module which is used for exporting the bridge construction monitoring data stored in the database in an Excel format. According to the bridge construction monitoring visualization system, the three-dimensional digital visualization and parameterization characteristics of the BIM are combined, so that the construction visibility can be effectively improved, and the understanding difficulty of bridge construction monitoring data is reduced.

Description

technical field [0001] The invention belongs to the technical field of construction industry information, in particular to a bridge construction monitoring visualization system based on Revit software. Background technique [0002] Whether the safety of the bridge construction process and the status of the completed bridge can meet the design requirements is a problem that bridge builders are very concerned about and must solve. To meet the requirements of construction safety and specific alignment and stress state, it is impossible to achieve only through post-mortem inspections. The whole process of construction is monitored to provide basis and guidance for the construction of subsequent sections. Due to my country's long-term extensive bridge construction management mode and backward informatization level, the data in the implementation process of bridge construction monitoring is usually displayed and transmitted in the form of documents and charts. As the structure be...

Claims


Application Information

Patent Timeline
IPC IPC(8): G06F30/13G06F30/20
Inventor 曹炳勇端茂军李国芬魏洋宋粲
Owner NANJING FORESTRY UNIV
Learn More