
Urban atmospheric pollution prediction method

A forecasting method and urban technology, applied in forecasting, climate sustainability, instruments, etc., can solve the problems of poor characteristics and timeliness of forecasting results, lack of locality and lack of process in pollution forecasting results, and achieve low data volume requirements , Local pollution characteristics are clear and effective

Pending Publication Date: 2021-08-13
HANGZHOU PUYU TECH DEV CO LTD
View PDF2 Cites 1 Cited by
  • Summary
  • Abstract
  • Description
  • Claims
  • Application Information

AI Technical Summary

Problems solved by technology

[0003] Traditional PM 2.5 Pollution prediction methods require a large amount of monitoring data and a large amount of investment
The prediction work based on the air quality model requires local source inventory data. Many regions in my country do not have a complete source inventory and the update period is long, resulting in poor local characteristics and timeliness of the prediction results.
However, only the big data machine training method is considered, and PM is not considered from the environmental point of view. 2.5 Atmospheric pollution processes from emission sources to diffusion, in predicting PM 2.5 Concentrations have limitations and pitfalls
[0004] In order to reduce the cost of environmental monitoring, increase the flexibility of environmental monitoring, and solve the pain points of lack of locality and lack of process in pollution prediction results, this patent provides an urban air pollution prediction method, such as atmospheric PM 2.5 Pollution Prediction Methods

Method used


Image

  • Urban atmospheric pollution prediction method
  • Urban atmospheric pollution prediction method
  • Urban atmospheric pollution prediction method

Examples


Embodiment 1

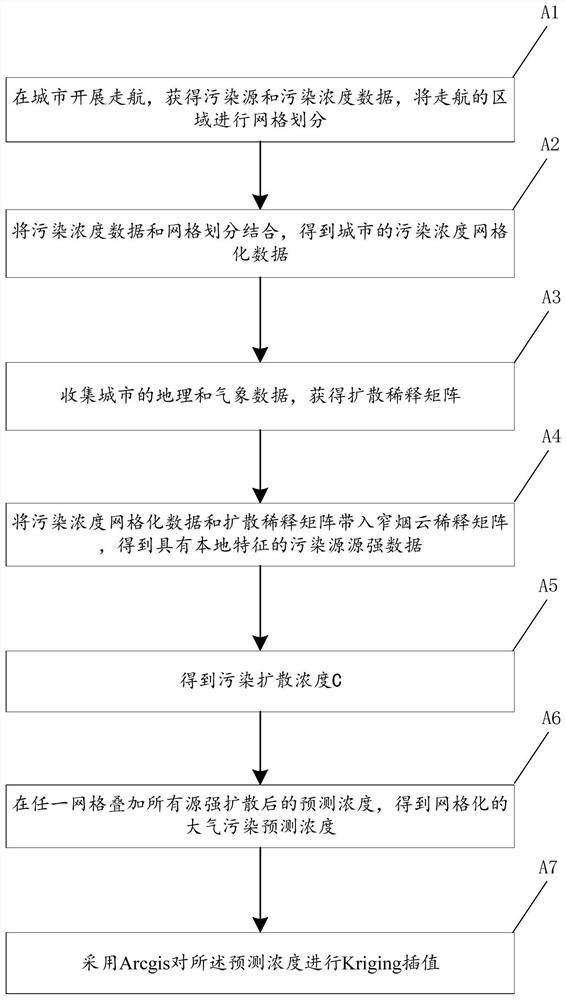
[0028] figure 1 Provide the flow chart of the urban air pollution prediction method of the embodiment of the present invention, as figure 1 Shown, described urban air pollution prediction method comprises the following steps:

[0029] (A1) Carry out navigation in the city to obtain data on pollution sources and pollution concentrations;

[0030] Divide the navigable area into grids;

[0031] (A2) combining the pollution concentration data with grid division to obtain the pollution concentration grid data of the city;

[0032] (A3) collecting geographical and meteorological data of the city to obtain the diffusion dilution matrix T;

[0033] (A4) Substituting the pollution concentration gridded data and the diffusion dilution matrix into the narrow smoke cloud dilution matrix to obtain the pollution source intensity matrix with local characteristics, thereby obtaining the pollution source intensity data Q;

[0034] (A5) Obtain the pollution diffusion concentration C,

[00...

Embodiment 2

[0045] According to the urban air pollution prediction method of embodiment 1 of the present invention in urban PM 2.5 Application example in pollution prediction.

[0046] In this application example, urban atmospheric PM 2.5 A pollution prediction method, including the following steps:

[0047] (A1) Carry out navigation in the city to obtain data on pollution sources and pollution concentrations;

[0048] to PM 2.5 In a heavily polluted city, carry out pre-stage analysis, clarify the city's functional areas, and determine the typical PM 2.5 Emission source. Carry out multi-directional PM in a city 2.5 Navigation work, the navigation area includes highways, factories, residential areas, parks, schools, hospitals, scenic spots, commercial centers, etc.;

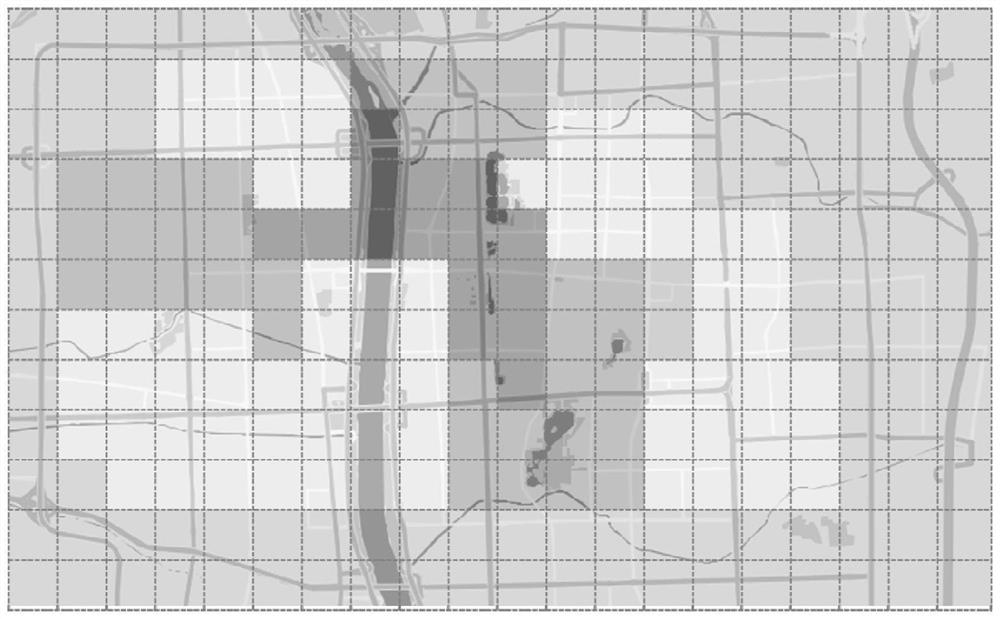
[0049] The navigation monitoring obtained the PM of a certain city 2.5 Concentration data with high spatial resolution, the data resolution is at the second level, basically covering the main areas of a city;

[0050]...


PUM


Abstract

The invention provides an urban atmospheric pollution prediction method which comprises the following steps: (A1) carrying out navigation in a city to obtain pollution source and pollution concentration data; carrying out grid division on the navigation area; (A2) combining the pollution concentration data with grid division to obtain pollution concentration gridding data of the city; (A3) collecting geographical and meteorological data of the city to obtain a diffusion dilution matrix T; (A4) substituting the pollution concentration gridding data and the diffusion dilution matrix into a narrow smoke cloud dilution matrix to obtain a pollution source intensity matrix with local characteristics so as to obtain pollution source intensity data Q; (A5) obtaining a pollution diffusion concentration C; and (A6) superimposing the predicted concentration after source intensity diffusion on any grid to obtain a gridded atmospheric pollution predicted concentration. The method has the advantages of accurate prediction and the like.

Description

technical field [0001] The invention relates to air pollution, in particular to a prediction method for urban air pollution. Background technique [0002] PM 2.5 It is one of the important pollutants in the atmosphere and has serious harm to the atmospheric environment and human health. Currently about PM 2.5 The monitoring technology has been relatively mature, and now the PM 2.5 Pollution prediction techniques are mainly based on air quality models (WRF-Chem, CMAQ, CAMx, etc.) or feature data machine training methods. [0003] Traditional PM 2.5 Pollution prediction methods require a large amount of monitoring data and require a large amount of investment. The prediction work based on the air quality model requires local source inventory data. Many regions in my country do not have a complete source inventory and the update period is long, resulting in poor local characteristics and timeliness of the prediction results. However, only the big data machine training met...

Claims


Application Information

Patent Timeline
IPC IPC(8): G06Q10/04G06Q10/06G06Q50/26
CPCG06Q10/04G06Q10/067G06Q50/26Y02A90/10
Inventor 邱语晴刘永林刘盈智韩双来刘立鹏
Owner HANGZHOU PUYU TECH DEV CO LTD
Learn More