Soil nitrogen estimation method based on vegetation coverage
A technology of vegetation coverage and soil nitrogen, applied in measuring devices, material analysis through optical means, instruments, etc., can solve the time-consuming and labor-intensive problems of soil nitrogen nutrient estimation, achieve wide coverage, fast analysis speed, and free The effect of removing manpower and material resources
- Summary
- Abstract
- Description
- Claims
- Application Information
AI Technical Summary
Problems solved by technology
Method used
Image
Examples
Embodiment 1
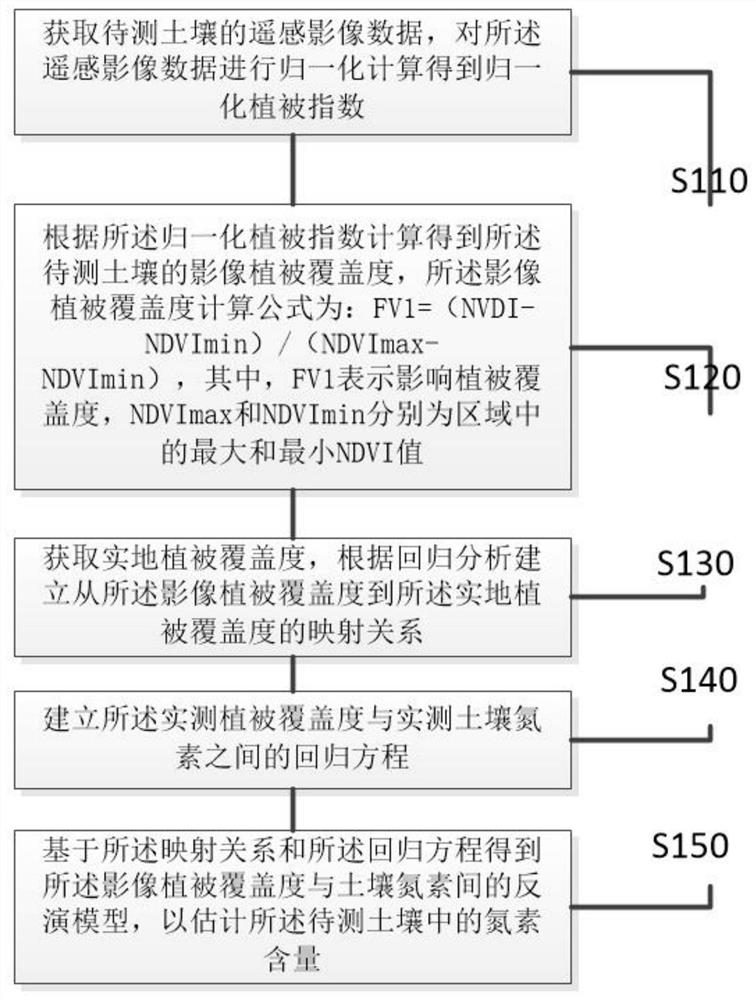
[0050] Such as figure 1 As shown, a soil nitrogen estimation method based on vegetation coverage includes the following steps:
[0051]S110. Obtain remote sensing image data of the soil to be measured, and perform normalized calculation on the remote sensing image data to obtain a normalized vegetation index;
[0052] S120. Calculate and obtain the image vegetation coverage of the soil to be measured according to the normalized difference vegetation index, the calculation formula of the image vegetation coverage is: FV1=(NVDI-NDVImin) / (NDVImax-NDVImin), wherein, FV1 Indicates the influence of vegetation coverage, NDVImax and NDVImin are the maximum and minimum NDVI values in the area, respectively;
[0053] S130. Acquire the vegetation coverage on the spot, and establish a mapping relationship from the vegetation coverage of the image to the vegetation coverage on the spot according to regression analysis;
[0054] S140, establishing a regression equation between the measu...
Embodiment 2
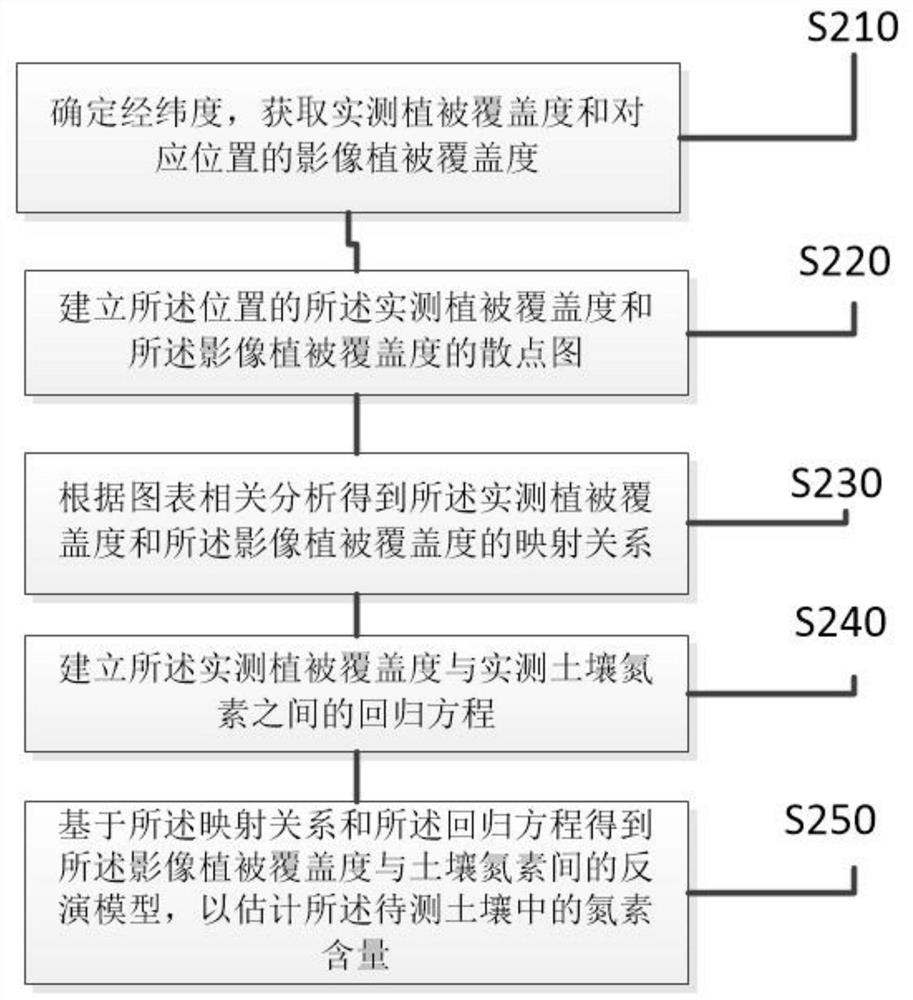
[0066] Such as figure 2 As shown, a soil nitrogen estimation method based on vegetation coverage, including:
[0067] S210. Determine the latitude and longitude, and obtain the measured vegetation coverage and the image vegetation coverage of the corresponding position;
[0068] S220. Establish a scatter diagram of the measured vegetation coverage and the image vegetation coverage of the location;
[0069] S230. Obtain a mapping relationship between the measured vegetation coverage and the image vegetation coverage according to chart correlation analysis;
[0070] S240. Establish a regression equation between the measured vegetation coverage and the measured soil nitrogen;
[0071] S250. Obtain an inversion model between the image vegetation coverage and soil nitrogen based on the mapping relationship and the regression equation, so as to estimate the nitrogen content in the soil to be measured.
[0072] It can be seen from Example 2 that the relationship between the image...
Embodiment 3
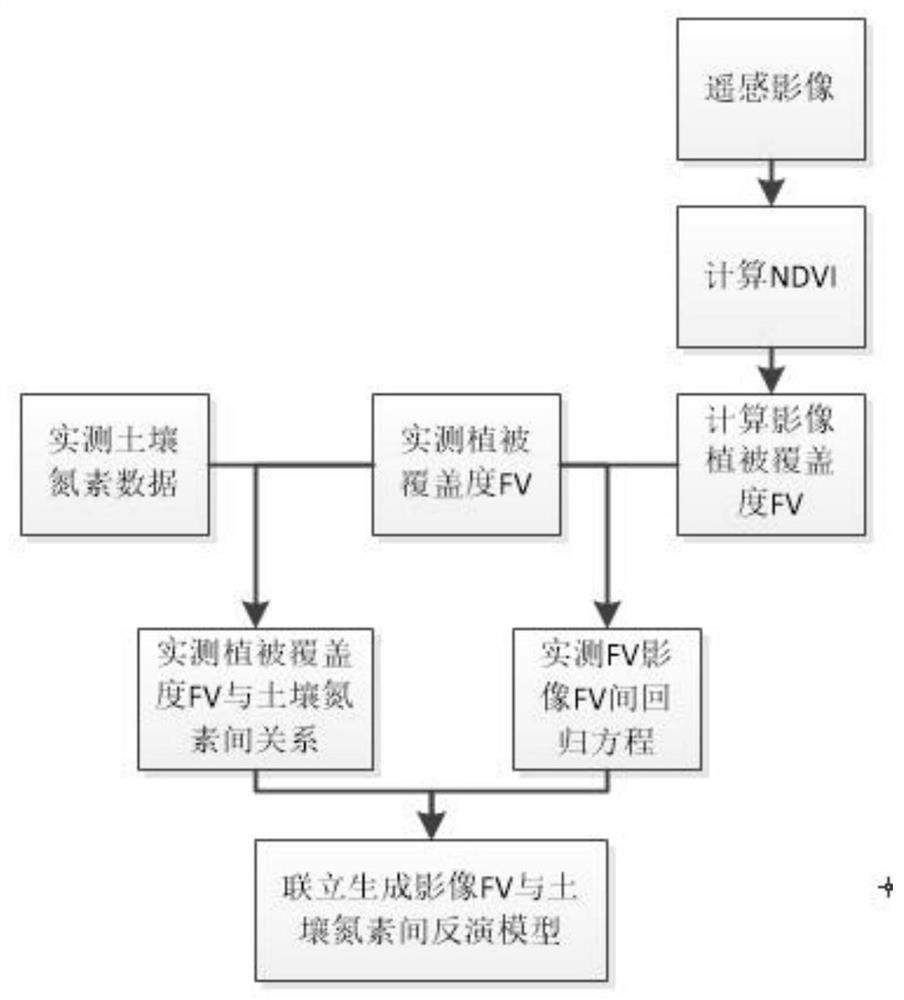
[0074] Such as image 3 As shown, a specific implementation manner can be:
[0075] Step 1: Acquisition of measured soil nutrient data
[0076] Firstly, select the quadrat area, and distribute it as evenly as possible to the entire research area, and follow the following rules in terms of quantity:
[0077] Sample size = (confidence level 2 *coefficient of variation 2 ) / acceptable relative deviation 2 , where the confidence level is generally selected as 0.95 or 0.99; the coefficient of variation can be estimated based on the historical data of the area, and when there is no historical data in the area, generally 0.1 to 0.3 can be used to roughly estimate the coefficient of variation. The coefficient of variation of available phosphorus and available potassium can be taken as 0.5; the acceptable relative deviation is generally limited to 0.2-0.3 in soil environmental monitoring. Because high-precision monitoring results are required, we set these coefficients as follows: ...
PUM
 Abstract
Description
Claims
Application Information
 - R&D
- Intellectual Property
- Life Sciences
- Materials
- Tech Scout
- Unparalleled Data Quality
- Higher Quality Content
- 60% Fewer Hallucinations
Browse by: Latest US Patents, China's latest patents, Technical Efficacy Thesaurus, Application Domain, Technology Topic, Popular Technical Reports.
© 2025 PatSnap. All rights reserved.Legal|Privacy policy|Modern Slavery Act Transparency Statement|Sitemap|About US| Contact US: help@patsnap.com


