Data visual display method of computer fluid mechanics in smelting process

A computational fluid dynamics and data technology, applied in the direction of calculation, electrical digital data processing, special data processing applications, etc., can solve the problems of computational data model visualization, poor scalability, and difficult human-computer interaction, etc., to achieve a highly targeted algorithm design , easy to check and adjust, easy to check the effect of adjustment

Inactive Publication Date: 2004-07-28
SHANGHAI JIAO TONG UNIV
View PDF0 Cites 0 Cited by
  • Summary
  • Abstract
  • Description
  • Claims
  • Application Information

AI Technical Summary

Problems solved by technology

[0004] In the actual research work of CFD visualization in the metallurgical industry, many researchers at home and abroad have found that a large amount of calculation data cannot be combined with the actual model visualization. At present, the main work is to carry out certain secondary development based on the universal data processing platform. Such problems There are: a) the geometric shape, grid data, flow field, temperature field, concentration field of the tundish cannot be combined with the calculation data, and the real "visualization" of the tundish calculation cannot be realized; b) it is difficult to realize the calculation based on the CFD model Data preprocessing and visualization of the concentration field and temperature field of any specified cross-section of the results; c) Human-computer interaction is difficult in the calculation process and data visualization; d) The program expansion is limited by the universal data processing platform, and the program module cannot be realized , poor scalability

Method used


Image

  • Data visual display method of computer fluid mechanics in smelting process
  • Data visual display method of computer fluid mechanics in smelting process
  • Data visual display method of computer fluid mechanics in smelting process

Examples


Embodiment Construction

[0046] In order to better understand the technical solution of the present invention, the accompanying drawings and the embodiments of the present invention will be further described below.

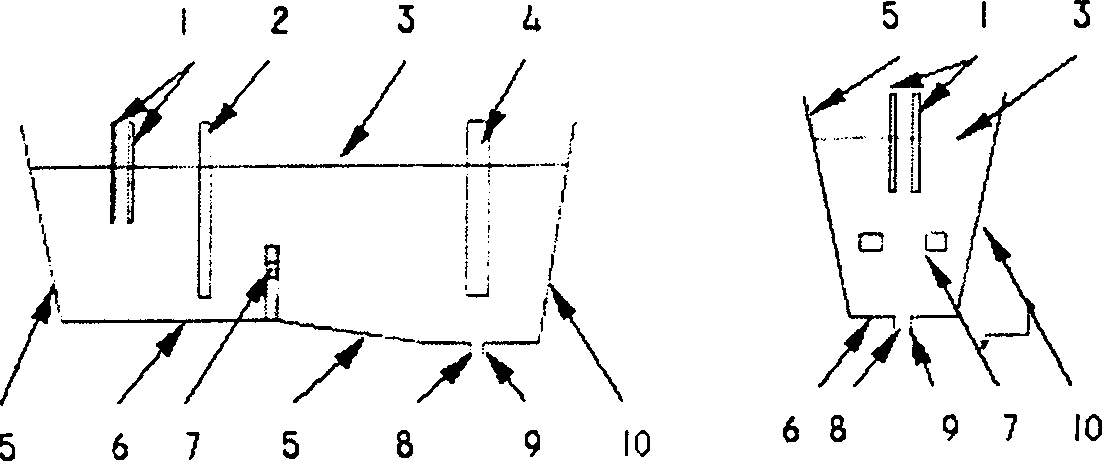
[0047] 1. Detailed definition of tundish boundary

[0048] Such as figure 1 As shown, 1 represents the boundary of the pipe wall, and each pipe corresponds to two rectangles (pipe walls on both sides in the cross-sectional view); 2 represents the boundary of the slag retaining wall, and each retaining wall should also be drawn with a rectangle; 3 represents the The boundary surrounded by the liquid surface is usually not considered by the calculation program above the liquid surface; 4 represents the stopper boundary type; 5, 6, 8 represent the boundary formed by the outer contour of the tundish; 7 represents the hole boundary type; 9 and 10 represent the boundary of the outlet pipe in the tundish outline; the boundary definition has two purposes, one is to simplify the calculation workl...


PUM


Abstract

The invention relates to the data visualization method of the computational fluid dynamics applied to the metallurgical process. The drawing platform realizes the automatic conversion between the rectangular coordinate system in drawing and the screen coordinate. The different middle package objects are drawn on the drawing platform. The borderline is defined as the connected place between two phases on the outer outline of the middle packages. Based on the mesh partitioning approach of the set theory, the meshes of the middle package are automatic partitioned. The constant value lines of the concentration field and temperature field etc. are converted to the graphic drawing. The data of the CFD are visualized. The invention can extend the visual contents, make the design and calculation be checked and adjusted easily.

Description

Technical field: [0001] The invention relates to a data visualization method of computational fluid dynamics in process metallurgy, which is used for computer-aided design calculations in industries such as metallurgy, and belongs to the technical fields of computer graphics and process metallurgy. Background technique: [0002] Computational Fluid Dynamics (CFD) was originally created in the field of aerospace. It is a method of studying fluid and heat transfer after traditional experimental and analytical methods. In the field of process metallurgy, the CFD model method can be used to calculate the flow and heat transfer of molten steel in the continuous casting tundish. The tundish is one of the most important reactors in continuous casting production, because the flow stability distribution affects the floating of inclusions in the tundish and the grain size of the slab, and the flow mode and temperature distribution of the molten steel in the tundish will affect the sla...

Claims


Application Information

Patent Timeline
Patent Type & Authority Patents(China)
IPC IPC(8): G06F17/50
Inventor 敬忠良李建勋张世俊肖刚
Owner SHANGHAI JIAO TONG UNIV
Why Eureka
Try Eureka