Colorimetric artificial nose having array of dyes and method for artificial olfaction
An artificial nose and dye technology, applied in the direction of analyzing materials, measuring color/spectral properties, using chemical indicators for analysis, etc., can solve problems such as inability to detect various vapors and interference
- Summary
- Abstract
- Description
- Claims
- Application Information
AI Technical Summary
Problems solved by technology
Method used
Image
Examples
Embodiment 1
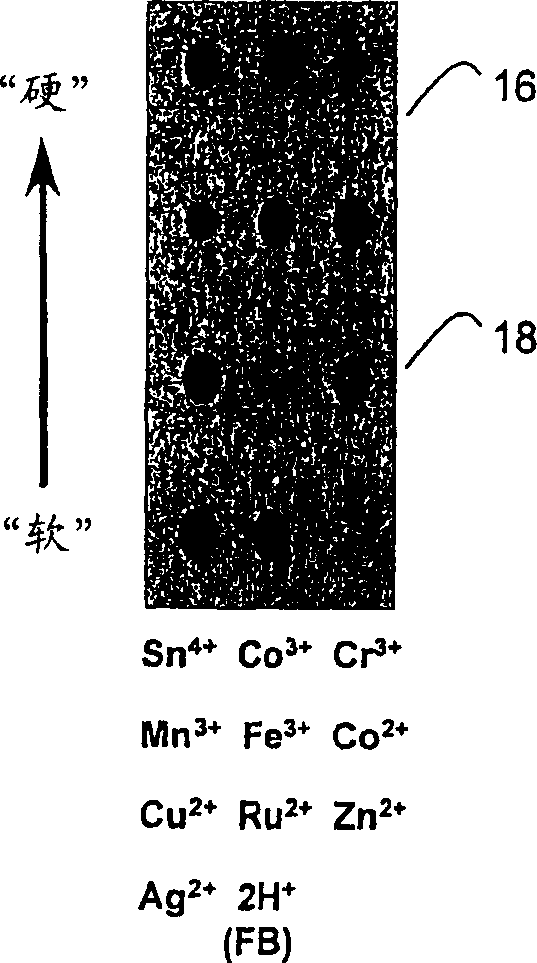
[0051] Scanning is performed at different time intervals, and the red, green and blue values of the new image are subtracted from the red, green and blue values ("RGB") of the original scan to obtain a color change pattern. Figure 4 The color change pattern of n-butylamine is shown in , where the color change pattern of the metalloporphyrin sensor array 16 is a function of the time of exposure to n-butylamine vapor. from exposure to N 2 The scan after 5 minutes minus the start scan was used as a control, as shown in the figure, which is a black reaction. then make N 2 9.3% of n-butylamine passed through the array and was scanned after 30 seconds, 5 minutes and 15 minutes. Subtracting the image (absolute value) of the red, green and blue value ("RGB") pattern yields the displayed color change pattern. Virtually all porphyrins are saturated after 30 seconds of exposure, producing a unique color fingerprint for each class of analyte, which is shown in Figure 4 middle. ...
Embodiment 3
[0076] Such as Figure 6 As shown, the arrays of the present invention generate translatable and reversible responses even to analyte mixtures of strong ligands such as pyridine and phosphite. The color change pattern of the mixture is different from that of either pure vapor. Such as Figure 6 As shown, this analyte pair exhibits good reversibility when the vapor mixture is cycled between the pure analyte poles, Figure 6 A two-component saturation reaction is shown for a mixture of 2-picoline ("2MEPY") and trimethyl phosphite ("TMP"). N that saturates both analytes 2 The gas streams are mixed at variable flow rates to obtain a vapor mixture. Expose the veneer first to N 2 in pure trimethyl phosphite vapor (scan A), then increase the mole fraction of 2-picoline until pure 2-picoline vapor is reached (scan C), then decrease the mole fraction of 2-picoline until Back to pure trimethyl phosphite vapor. Scanning at the same mole fraction of trimethylphosphite in both direc...
Embodiment 4
[0080] In our effort to understand the cause of the color change upon exposure to vapor, diffuse reflectance spectra of individual porphyrin spots were obtained before and after exposure to analyte vapor. The porphyrin solution was applied to the plates in 50 [mu]L aliquots and dried under vacuum at 50[deg.]C. The diffuse reflectance spectrum of the plate was then measured with a UV-visible spectrophotometer equipped with an integrating sphere. The unique spectral shifts observed upon exposure to analytes correlate well with those seen from solution coordination. For example, exposure of Zn(TPP) to ethanol and pyridine exhibits distinctive spectral shifts that are very similar to those obtained from ligand exposure in solution. Figure 7 Shown is a comparison of the spectral shift of Zn(TPP) exposed to ethanol and pyridine (py) in dichloromethane solution (A) and on a reversed-phase support (B). In A and B, the bands from left to right correspond to Zn(TPP), Zn(TPP) (C 2 h ...
PUM
 Abstract
Description
Claims
Application Information
 - R&D
- Intellectual Property
- Life Sciences
- Materials
- Tech Scout
- Unparalleled Data Quality
- Higher Quality Content
- 60% Fewer Hallucinations
Browse by: Latest US Patents, China's latest patents, Technical Efficacy Thesaurus, Application Domain, Technology Topic, Popular Technical Reports.
© 2025 PatSnap. All rights reserved.Legal|Privacy policy|Modern Slavery Act Transparency Statement|Sitemap|About US| Contact US: help@patsnap.com


