

Monitoring upstream frequency band
A frequency and frequency mixing technology, applied in the electronic field, can solve the problems of data throughput impact, inability to respond quickly to noise changes, and spending a certain amount of time
- Summary
- Abstract
- Description
- Claims
- Application Information
AI Technical Summary
Problems solved by technology
Method used
Image

Examples
no. 1 example
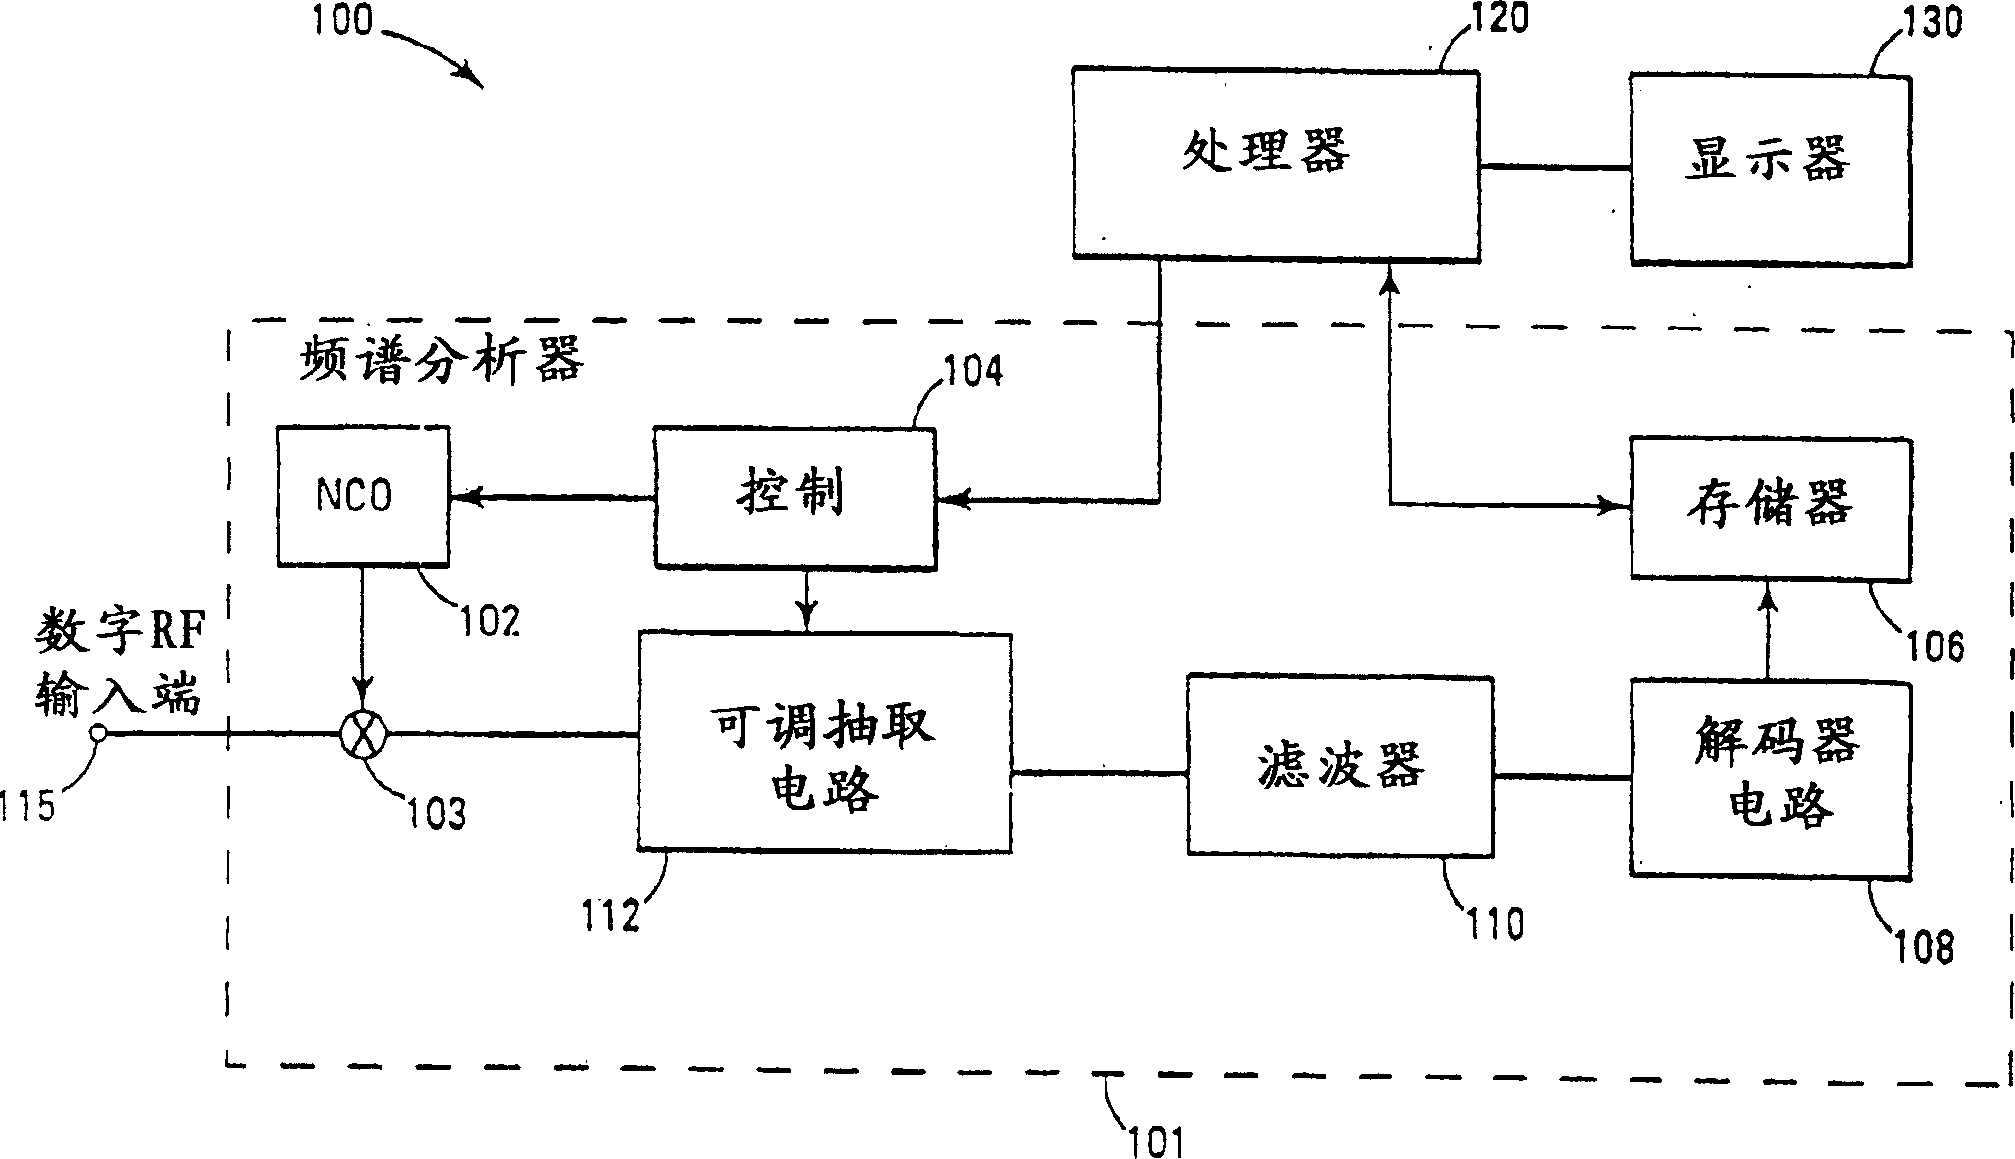
[0031] figure 1 is a block diagram of an embodiment of an analysis system, indicated at 100, according to the present invention. System 100 includes a digital radio frequency (RF) input 115 designed to receive an input signal. In one embodiment, the input signal is a digitized upstream signal from a DOCSIS compliant, European DOCSIS compliant or other suitable cable modem. System 100 selectively measures the power level of the incoming signal at a plurality of frequencies to advantageously allow service providers to identify portions of the spectrum that should not be used to communicate digital data.
[0032] System 100 includes a spectrum analyzer 101 that prepares said input signal for processing. The digital RF input 115 is coupled to the mixer 103, which generates a down-converted signal from the received input signal. System 100 includes adjustable decimation circuit 112 coupled to mixer 103 . The adjustable extraction circuit 112 selectively extracts the down-conver...
no. 2 example
[0045] Figure 4 is a block diagram of one embodiment of a digital downconverter, indicated at 400, in accordance with the present invention. The digital down converter 400 includes a plurality of input ports 1 to N. Digital downconverter 400 also includes a plurality of N-to-1 multiplexers 450-1 to 450-M. Each N to 1 multiplexer 450-1 through 450-M is coupled to a path 460-1 through 460-M. In one embodiment, each of said paths 460-1 through 460-M includes a digital downconverter circuit of the type described in the common designation entitled "Digital Downconverter" and filed at described in the pending application no. (Attorney of Records Abstract No. 100.225US01). In other embodiments, other suitable digital downconverter circuits are used. Each channel 460-1 through 460-M is coupled to a receiver.
[0046] Under the control of control circuit 475, each channel 460-1 to 460-M downconverts a selectable channel from one of the input ports 1 to N. Control circuitry 475 i...
no. 3 example
[0051] Figure 5 is a block diagram, indicated generally at 500, of one embodiment of a signal analysis system according to the present invention. System 500 includes a digital radio frequency (RF) input 515 designed to receive an input signal. In one embodiment, the input signal is a digitized upstream signal from a DOCSID compliant, European DOCSIS compliant or other suitable cable modem. System 500 selectively estimates the impact of noise on the pathway. In one embodiment, system 500 allows a service provider to check for noise in channels that are not currently in use to determine if they are usable.
[0052]System 500 includes a time domain analyzer 509 that prepares the input signal for processing. The digital RF input 515 is coupled to the mixer 503 which generates a down-converted signal from the received input signal. System 500 includes adjustable decimation circuit 512 coupled to mixer 503 . The adjustable decimation circuit 512 selectively decimates the down-...
PUM
 Abstract
Description
Claims
Application Information