

Cycle sampling method in quality of power supply in electrical network
A technology for power quality and power grids, applied in frequency measurement devices, spectrum analysis/Fourier analysis, etc., can solve problems such as large measurement errors and lost sampling points
- Summary
- Abstract
- Description
- Claims
- Application Information
AI Technical Summary
Problems solved by technology
Method used
Image

Examples
Embodiment 2
[0059] Follow the steps below in order:
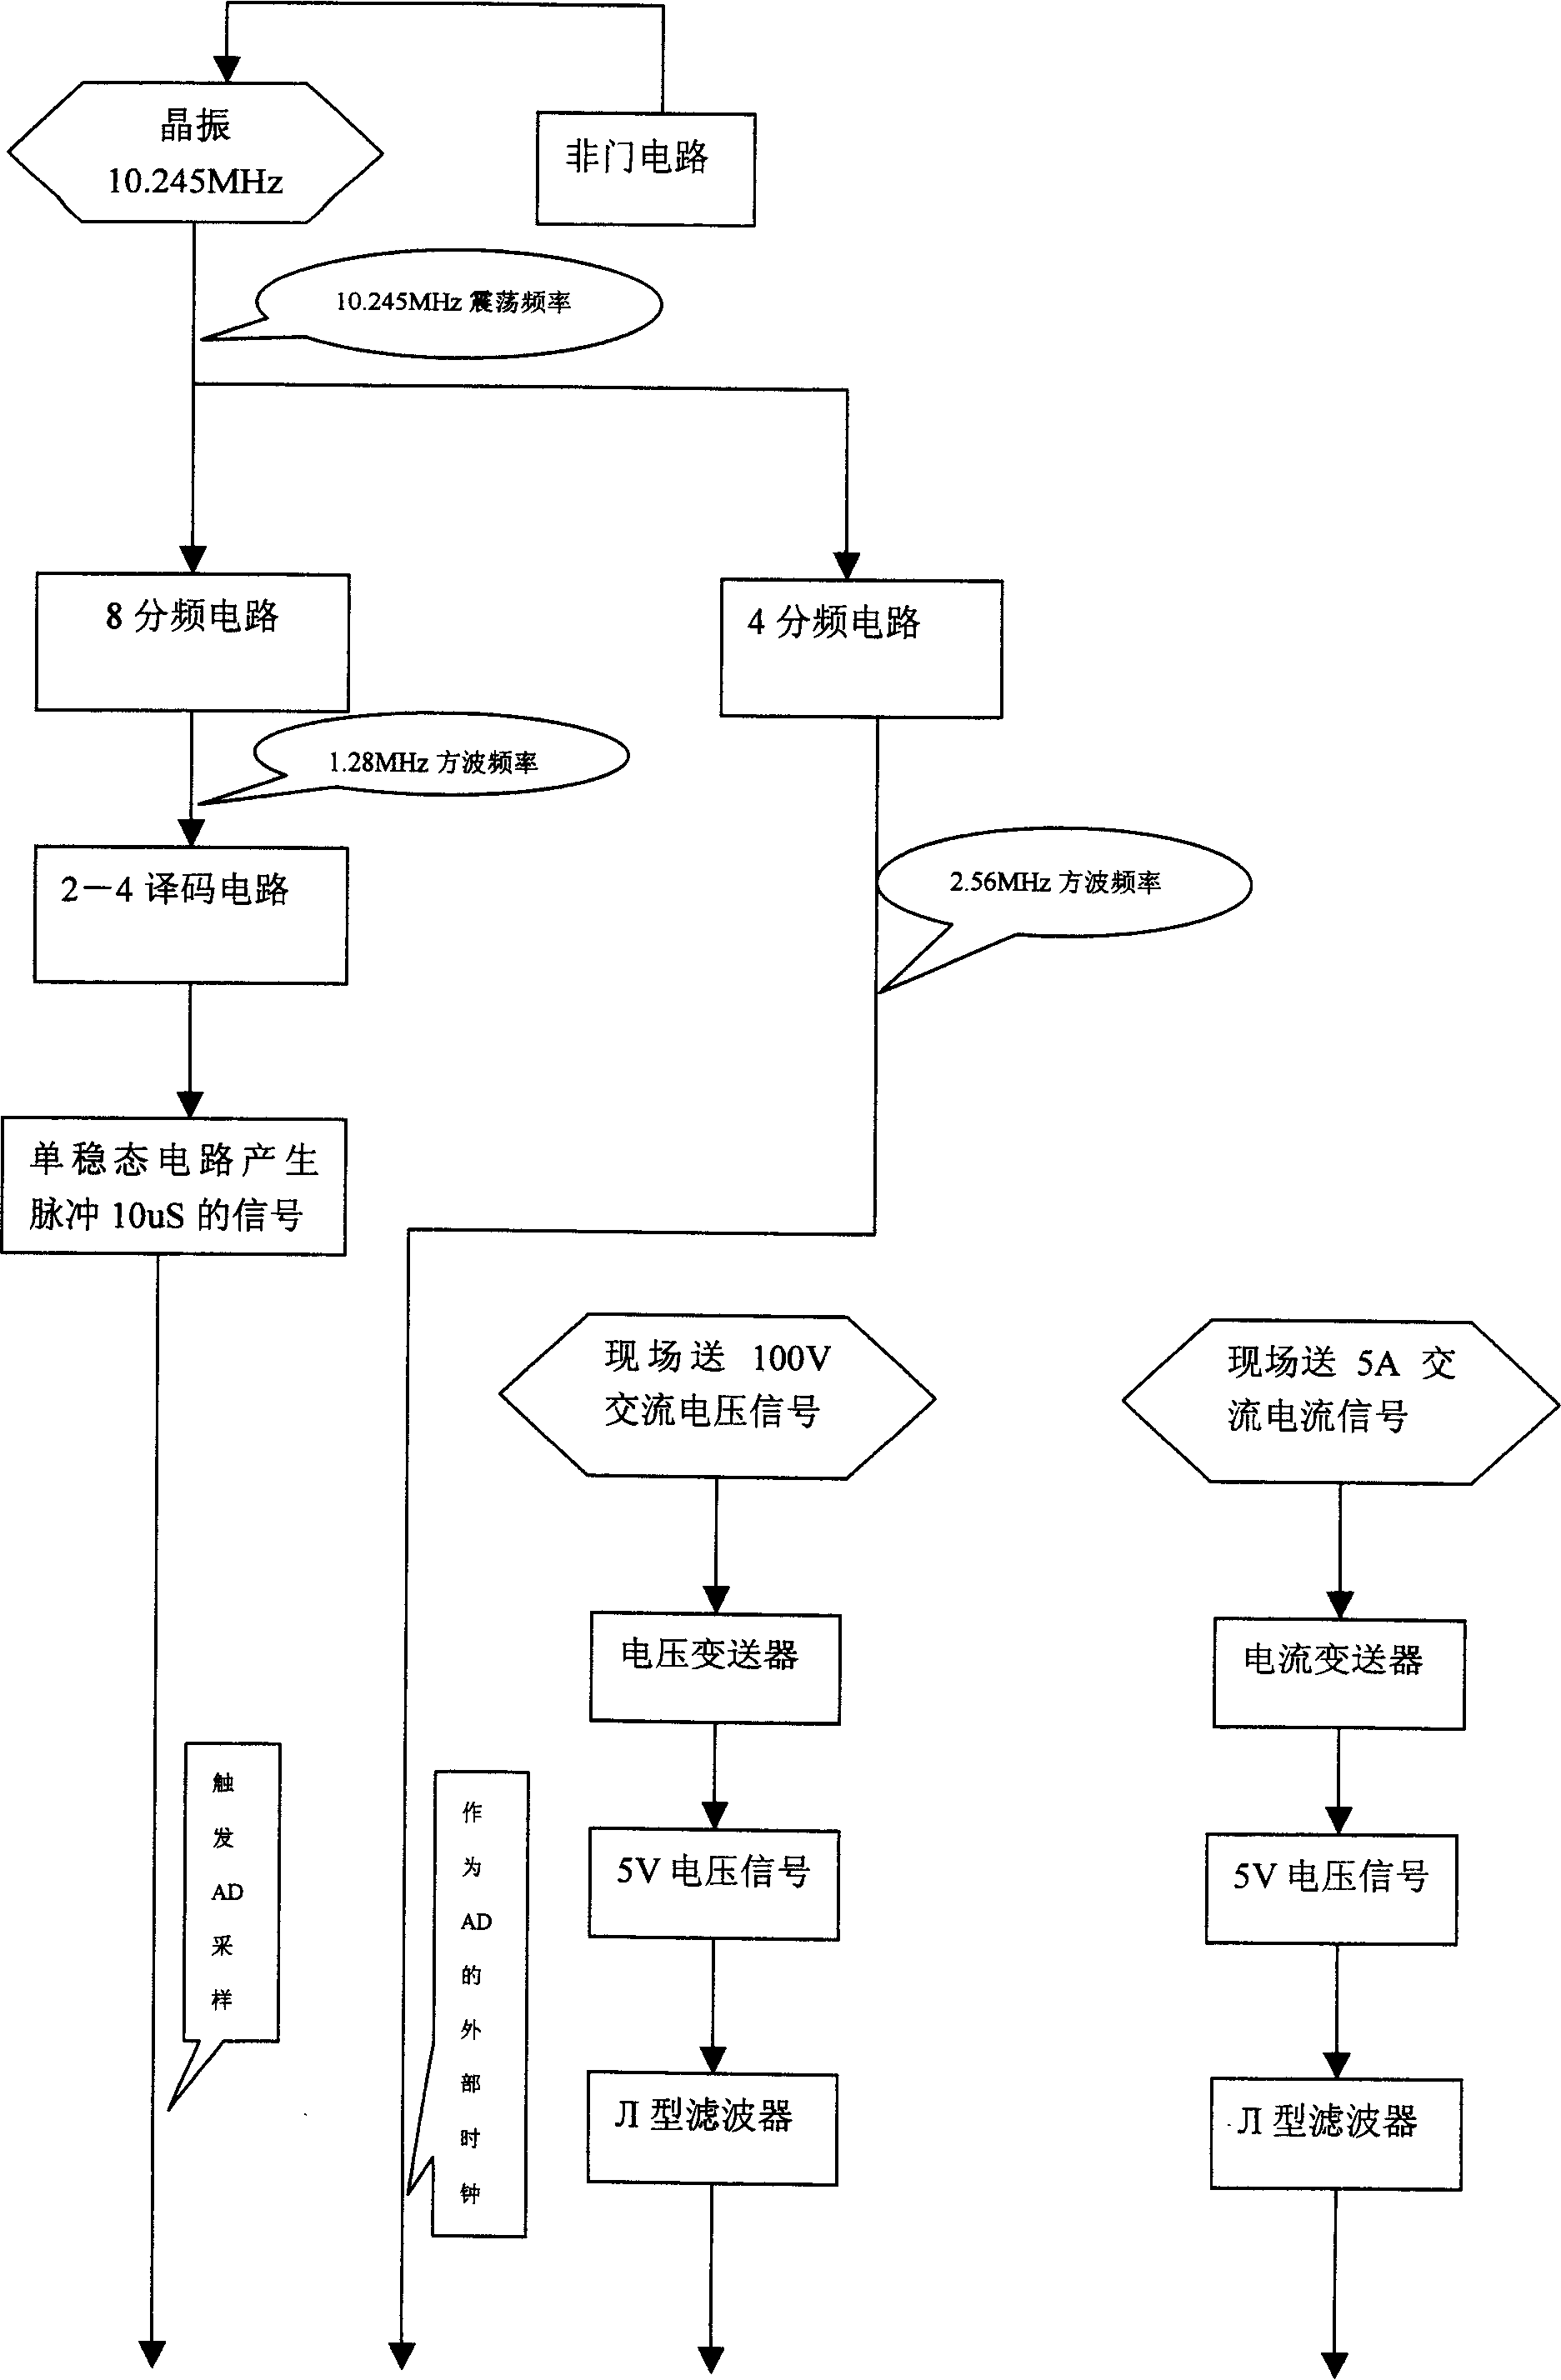
[0060] 1. According to the frequency of 6.4KHz (f=2 n *50Hz, n=7) sampling frequency to collect secondary side voltage and current, collecting 128 points
[0061] 2. Carry out waveform fitting with the least square method, restore the collected 128 points to the waveform,
[0062] 3. Find the zero-crossing point of the waveform by the method of least squares, and determine a complete cycle,
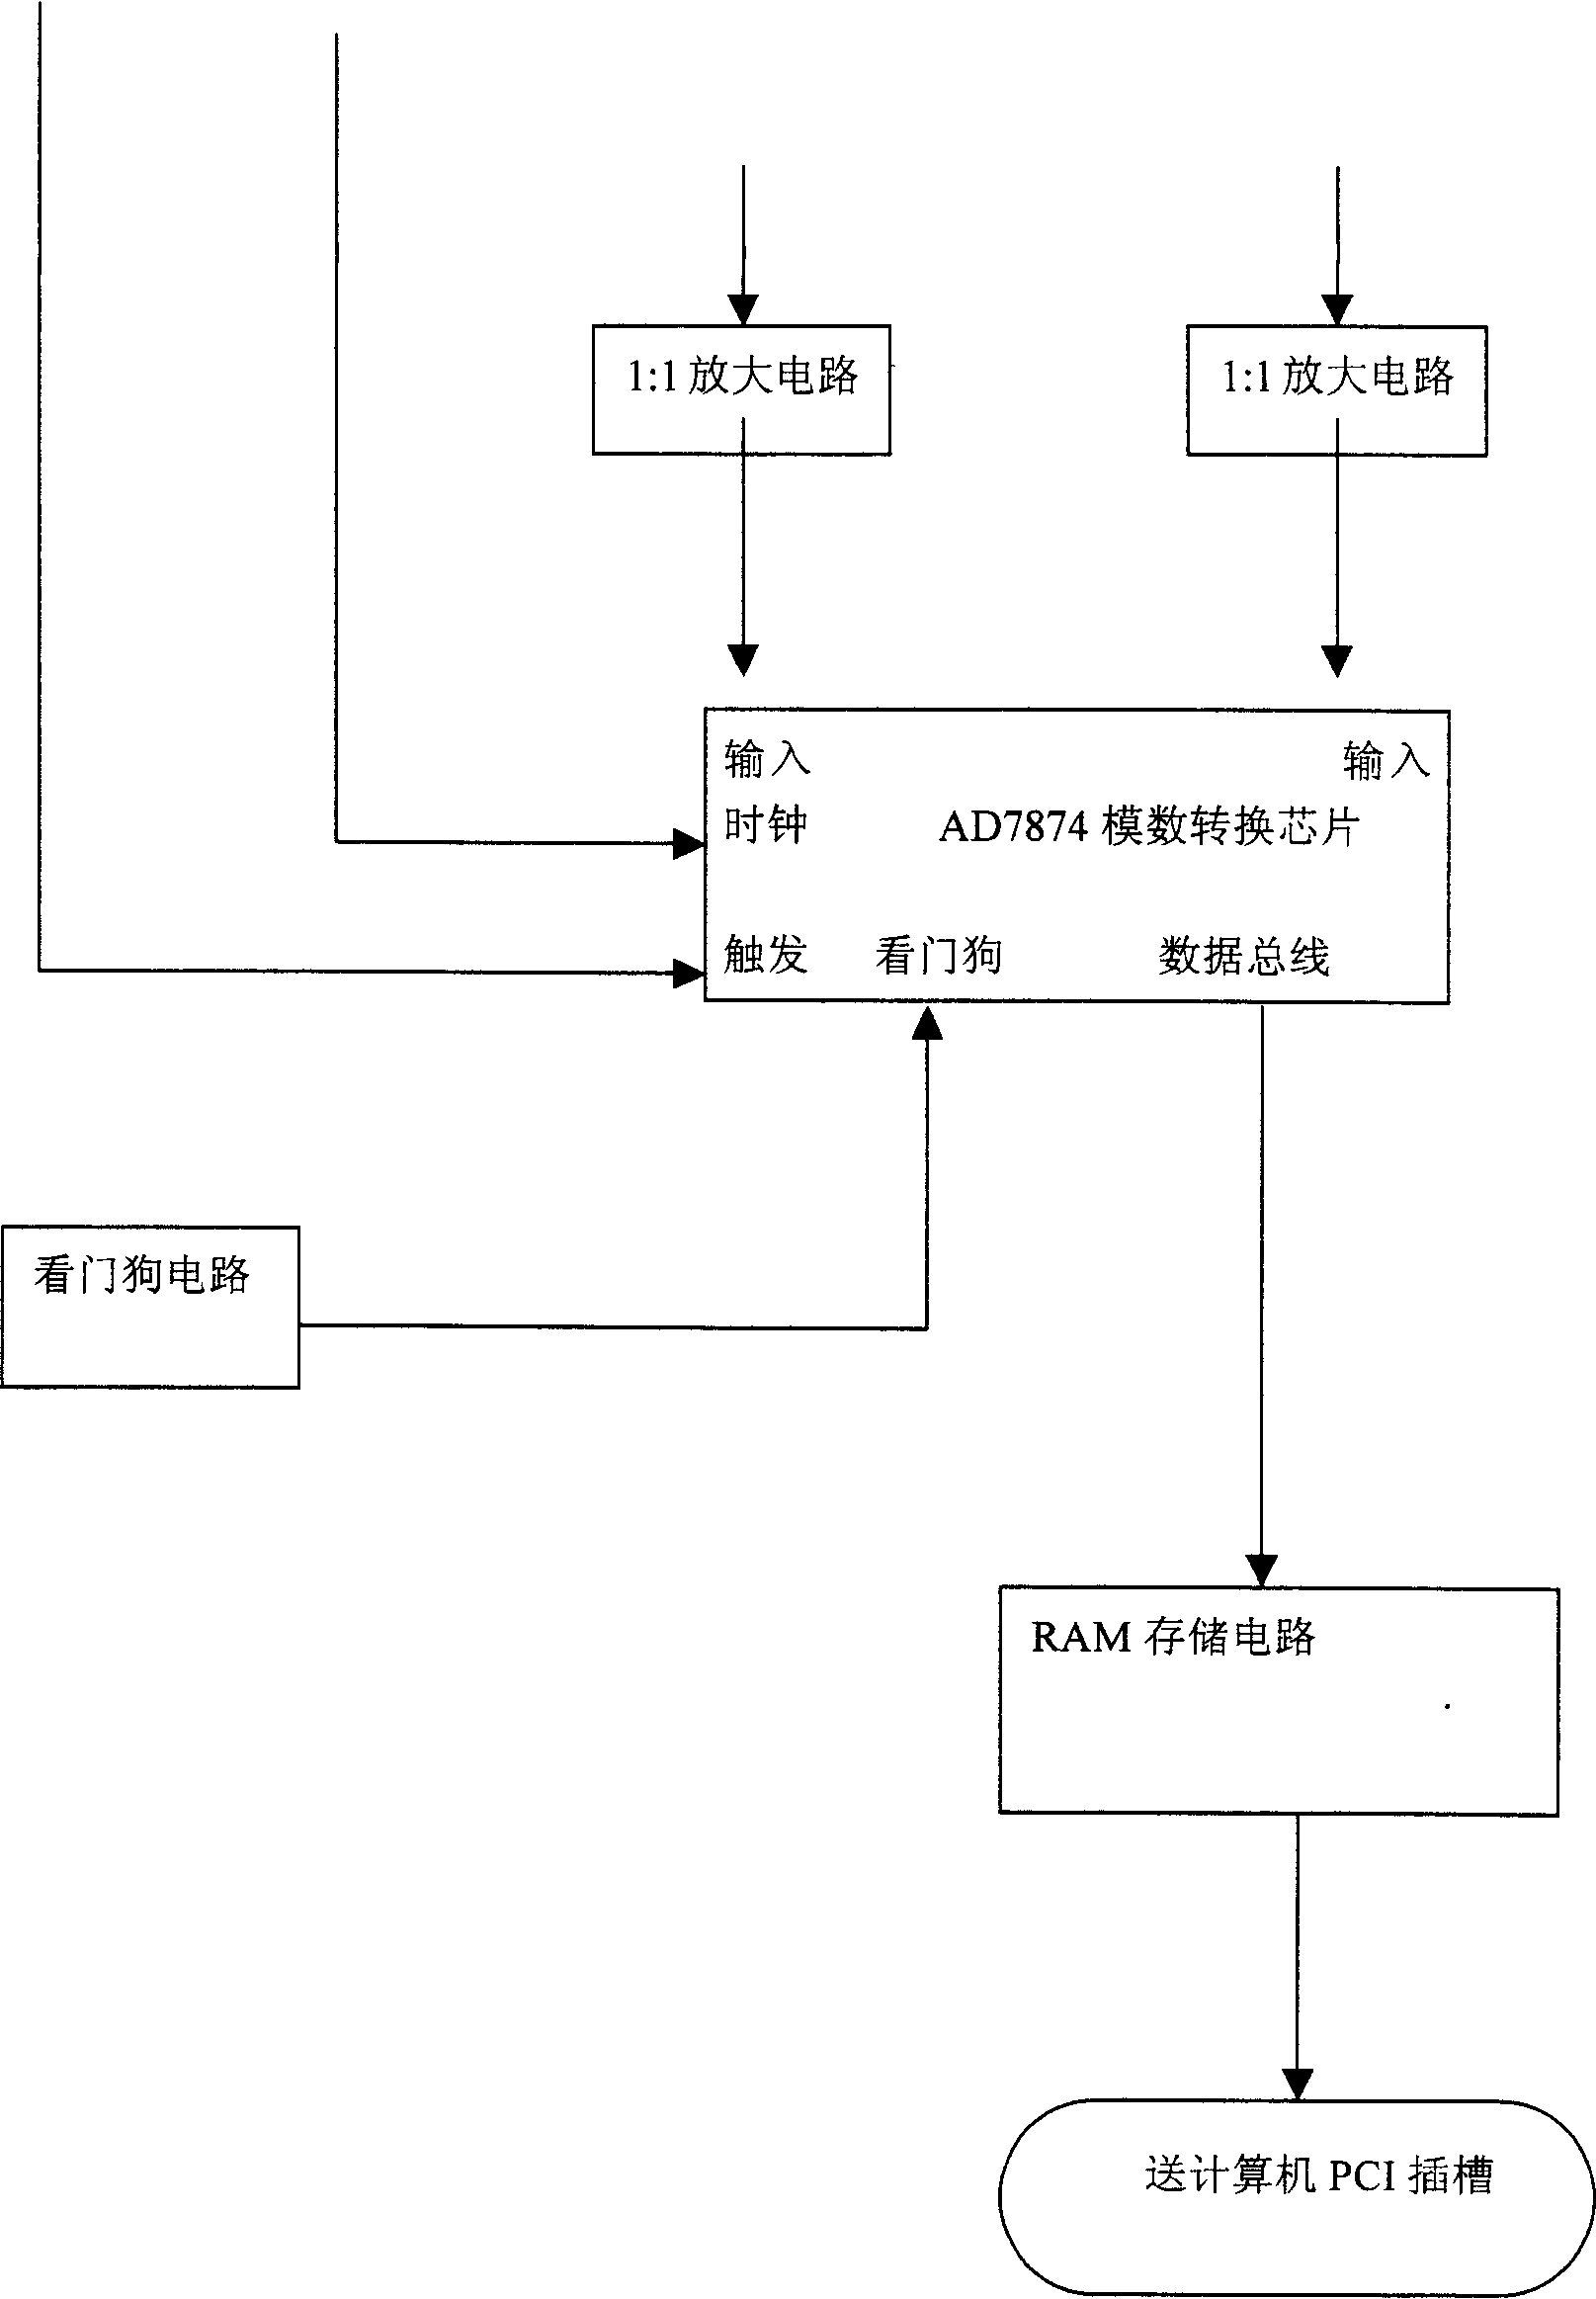
[0063] 4. According to the sampling frequency of f=128*50Hz, the fitting waveform obtained above is re-sampled, and 128 points are collected.
[0064] 5. Analyze the power quality index values in the power system according to the AC signal values such as voltage and current at 128 points.
[0065] The principle of the hardware of embodiment 2 and the flow process of software are similar to embodiment 1, wherein, transmitter adopts 16 voltage-type and current-type transmitters, those skilled in the art need not pay Creative labor can be rea...
Embodiment 3
[0067] Follow the steps below in order:
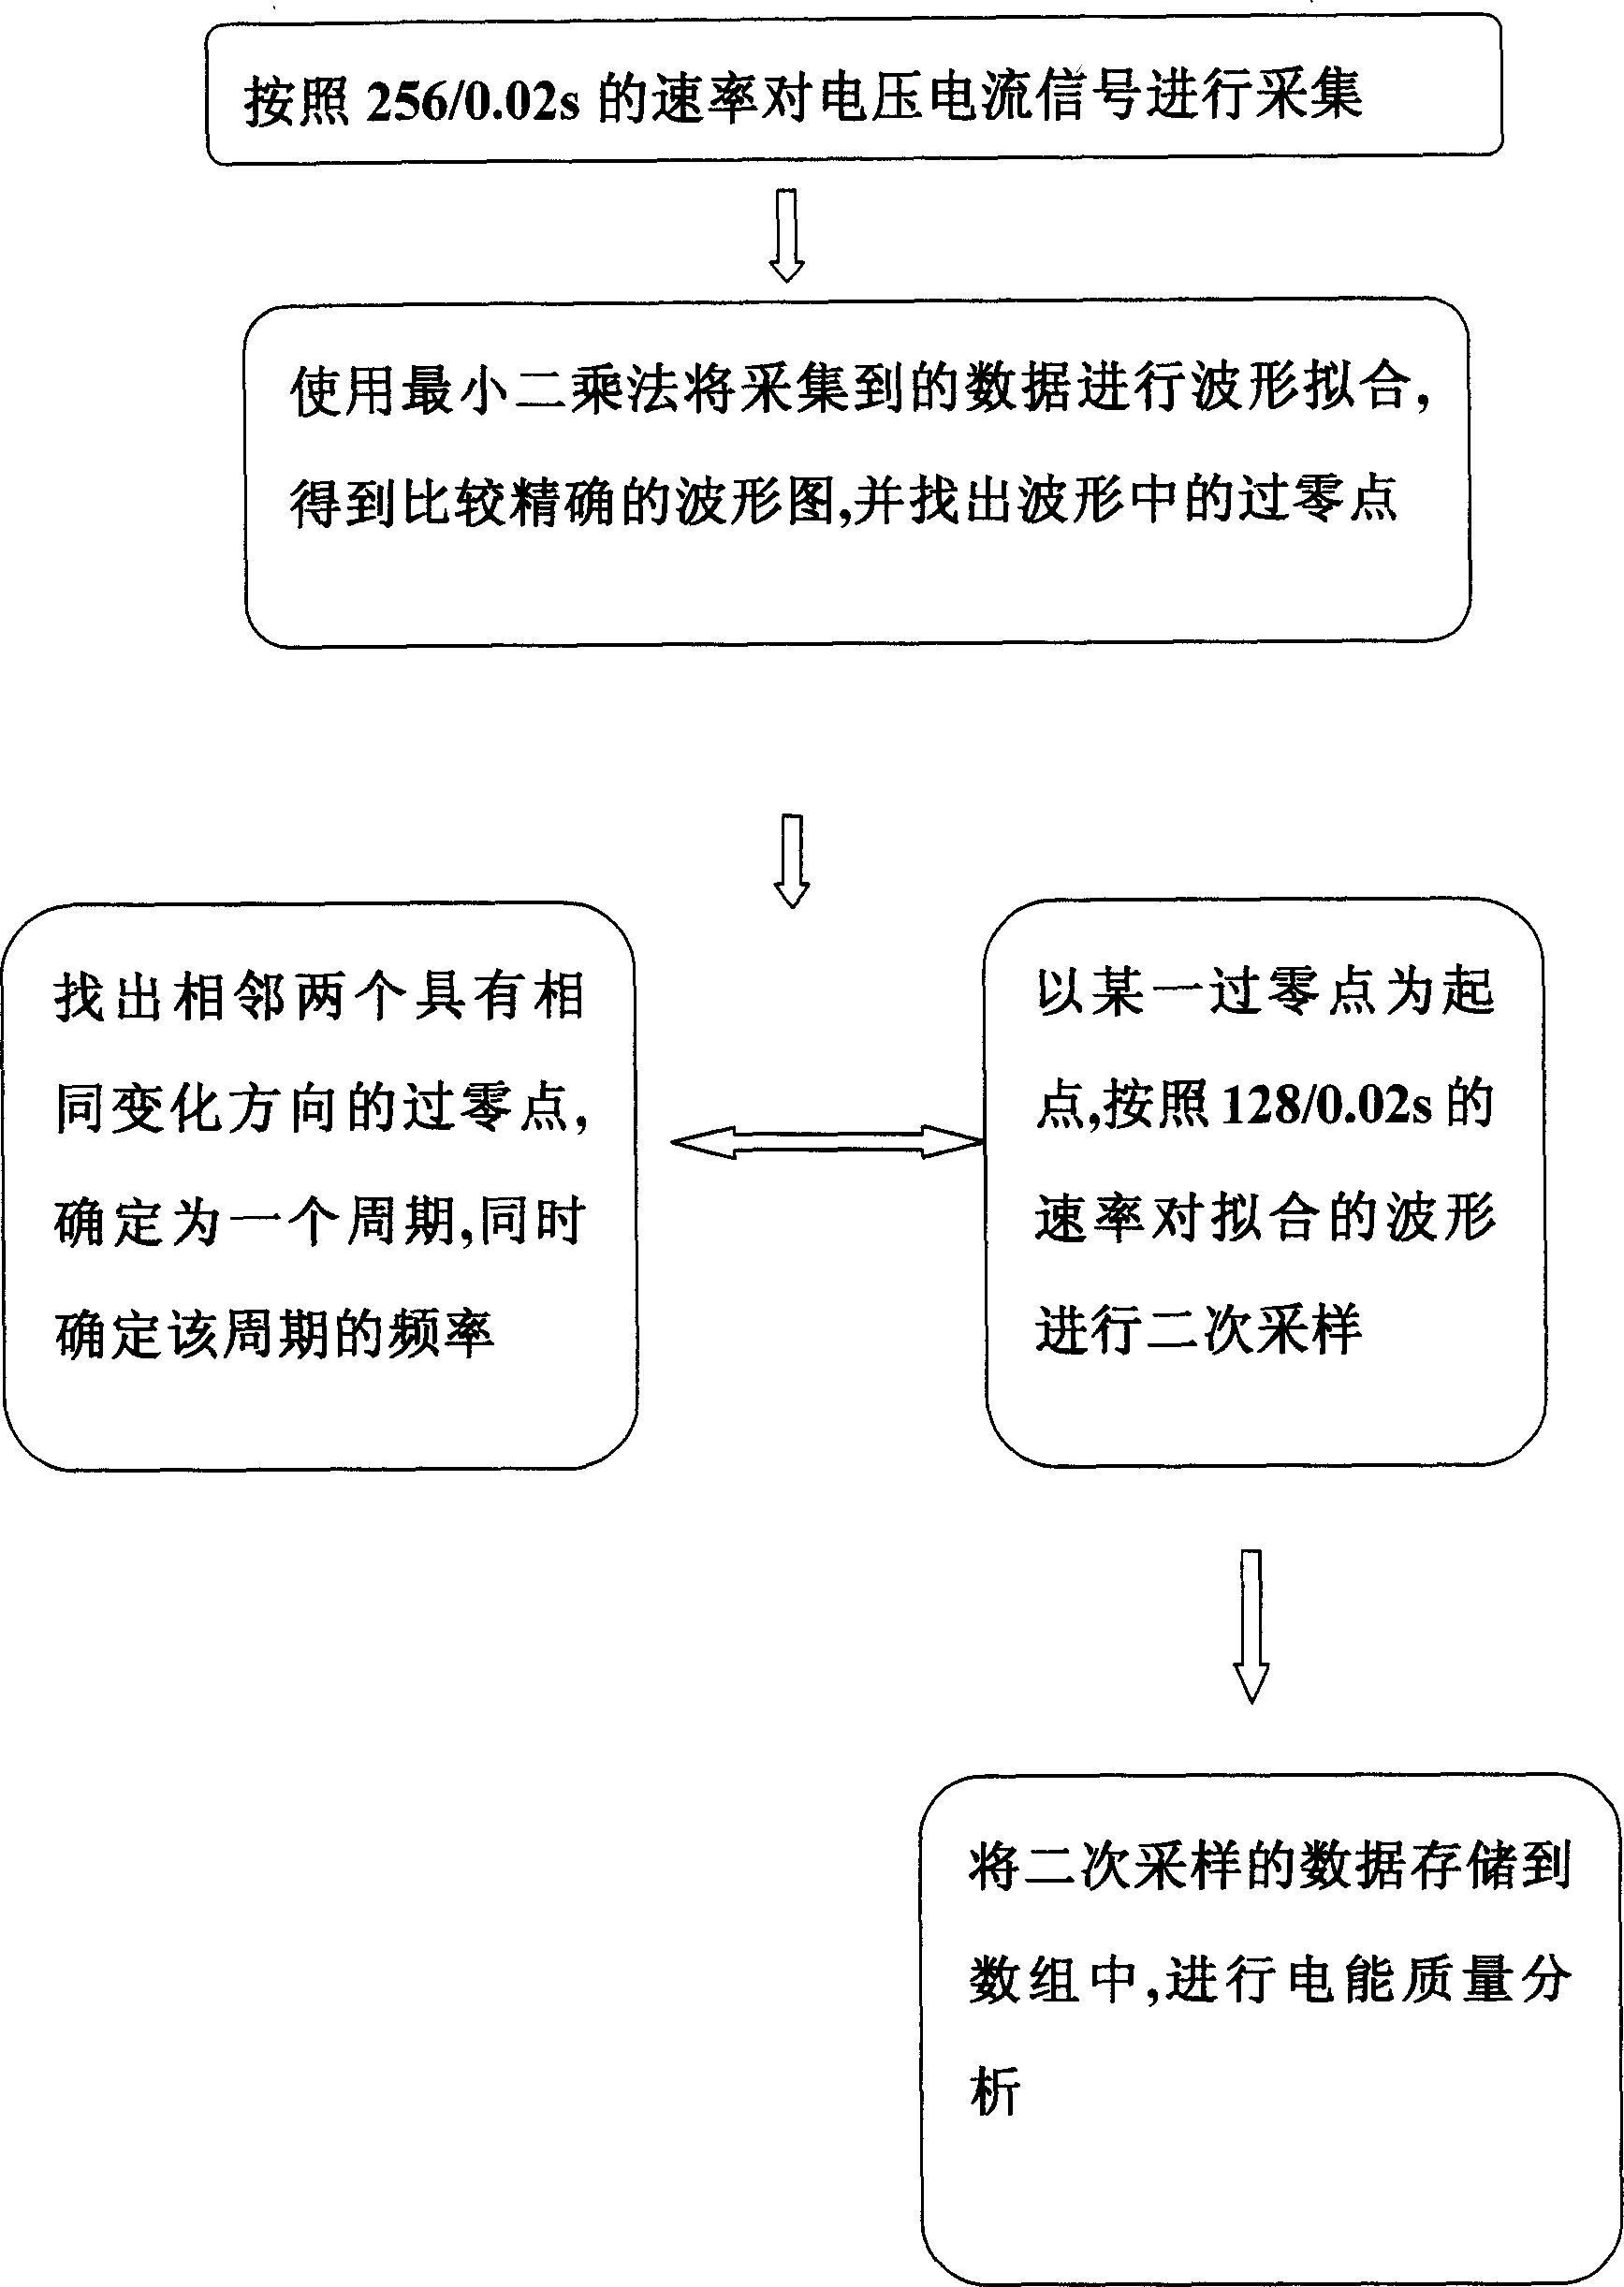
[0068] 1. According to the frequency f=2 n *50Hz, n=8 sampling frequency to collect secondary side voltage and current, collect 256 points
[0069] 2. Fit and restore the collected 256 points to the waveform by linear interpolation
[0070] 3. Use the wavelet transform method to find out the zero-crossing point of the waveform to determine a complete cycle.
[0071] 4. According to f=2 n *50Hz, n=6 sampling frequency, re-sampling the fitted waveform obtained above, collecting 64 points,
[0072] 5. Analyze the value of each power quality index in the power system according to the AC signal values such as voltage and current at 64 points.
[0073] The principle of the hardware and the flow of the software of the third embodiment are similar to those of the first embodiment.
Embodiment 4
[0075] Follow the steps below in order:
[0076] According to frequency f=2 n *50Hz, n=9 sampling frequency to collect secondary side voltage and current, collect n1 points
[0077] Fit the collected n1 points into a waveform by the least square method,
[0078] Use the least squares method to find the zero crossing point of the waveform to determine a complete cycle,
[0079] According to the sampling frequency of f=2n*50Hz, n=8, the fitting waveform obtained above is re-sampled, and n2 points are collected,
[0080] According to the AC signal values such as voltage and current of n2 points, the value of each power quality index in the power system is analyzed.
[0081] The principle of the hardware and the flow of the software of the fourth embodiment are similar to those of the first embodiment.
[0082] The above-mentioned embodiments of the present invention have been adopted in practice, and good technical effects have been achieved. The accuracy of measuring each...
PUM
 Abstract
Description
Claims
Application Information