Method of analyzing an iron melt

a technology of iron melt and analysis method, which is applied in the field of analysis of iron melt, can solve the problems of not easy control or monitoring of oxygen content, nodular graphite formation at lower residual magnesium in the treated iron, and certain degree of uncertainty of how much magnesium that will be required, so as to achieve easy detection, less importance to prediction, and easy detection

Active Publication Date: 2019-05-28
VOLVO LASTVAGNAR AB
View PDF13 Cites 0 Cited by
  • Summary
  • Abstract
  • Description
  • Claims
  • Application Information

AI Technical Summary

Benefits of technology

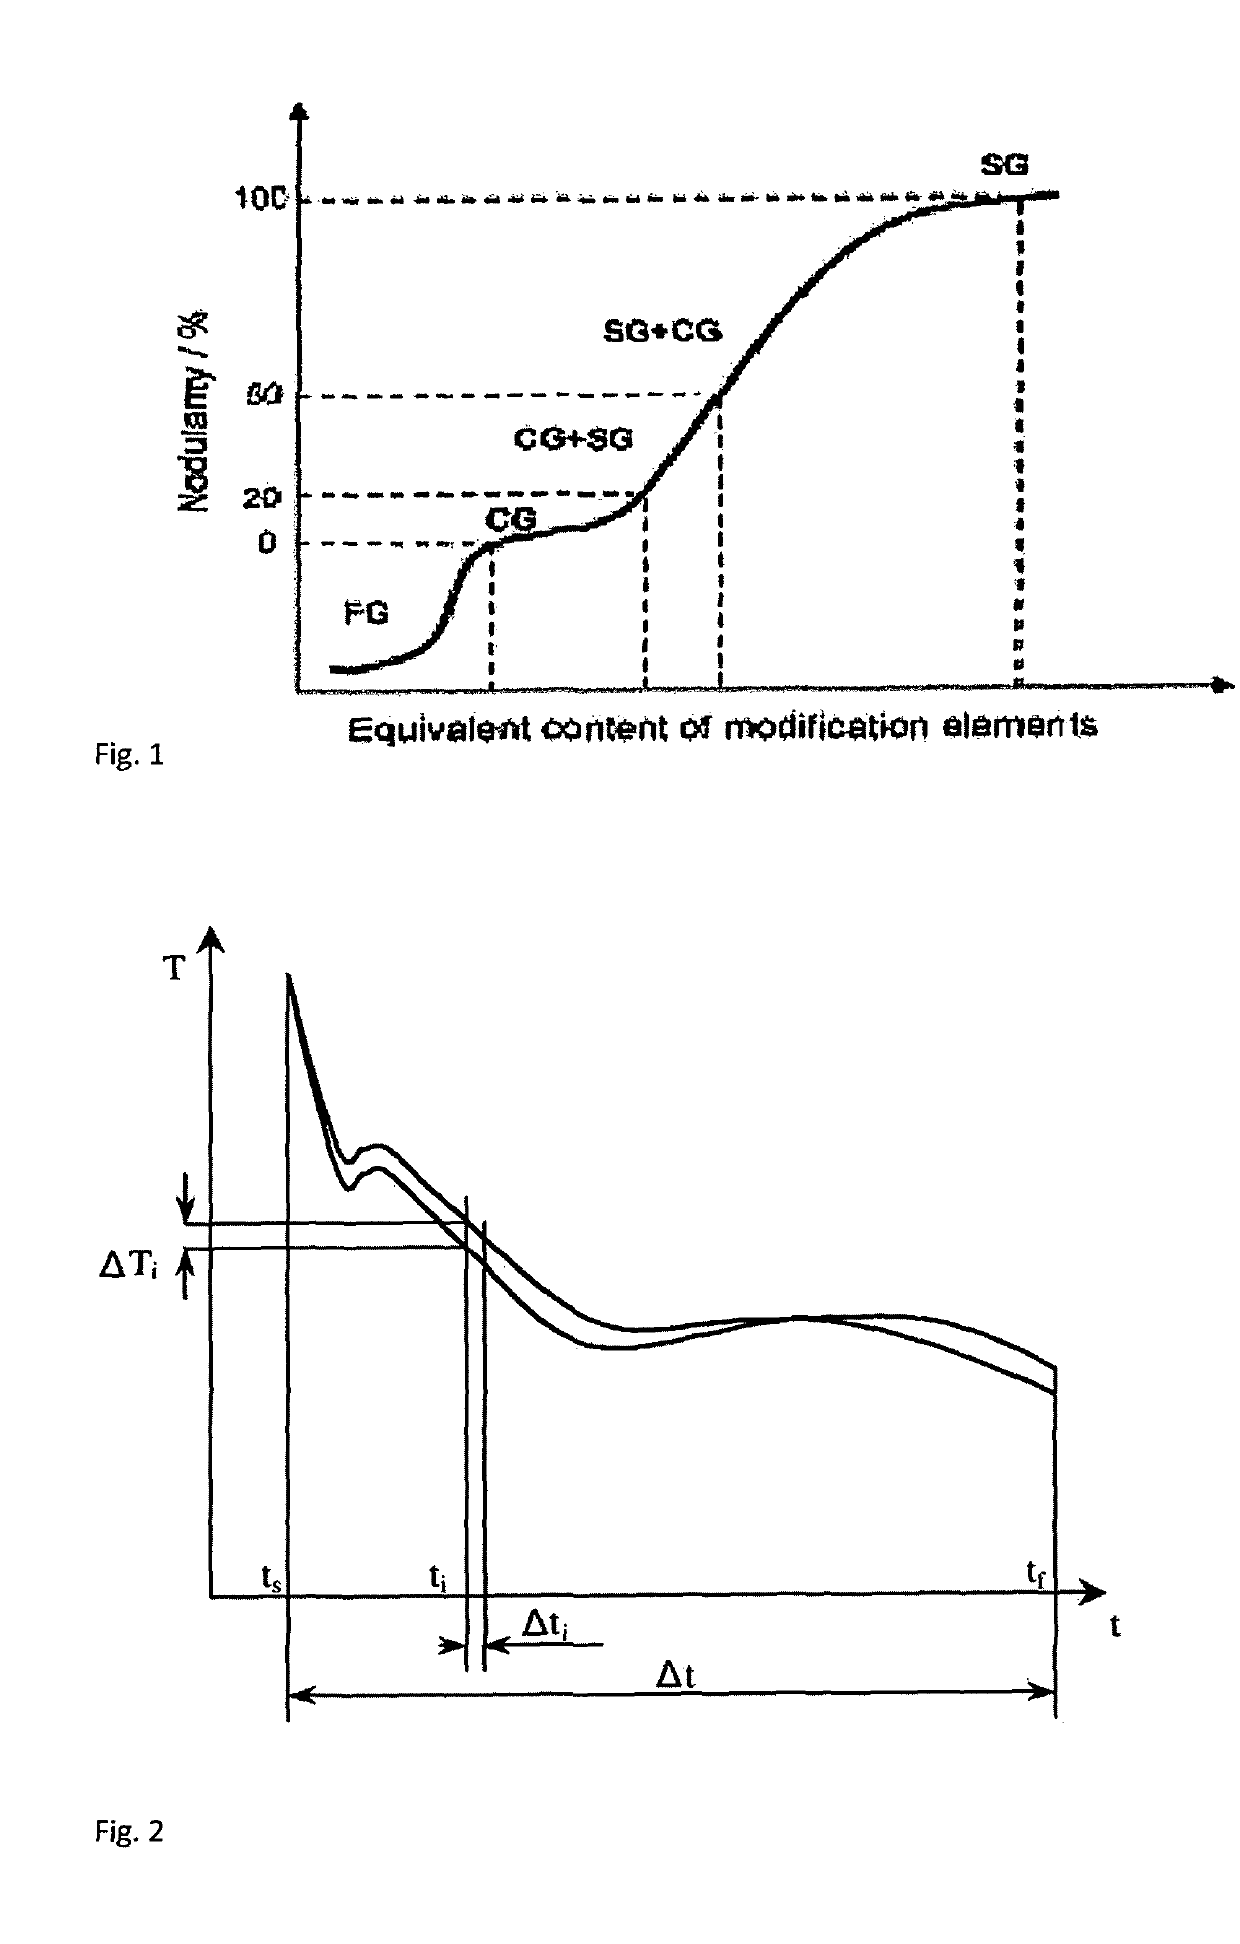
[0005]In comparison to either grey iron or ductile iron, the entangled compacted graphite clusters interlock themselves into the iron matrix to provide a strong adhesion. This graphite shape suppresses crack initiation and propagation and is the source of both the increased mechanical properties relative to grey iron and the improved thermal conductivity relative to ductile iron. These advantageous properties of CGI have made it a suitable material for cylinder blocks of internal combustion engines, in particular diesel engines. High titanium content CGI is also commonly used in exhaust manifold and power steering pump parts thanks to a very good thermal conductivity and high-temperature strength.
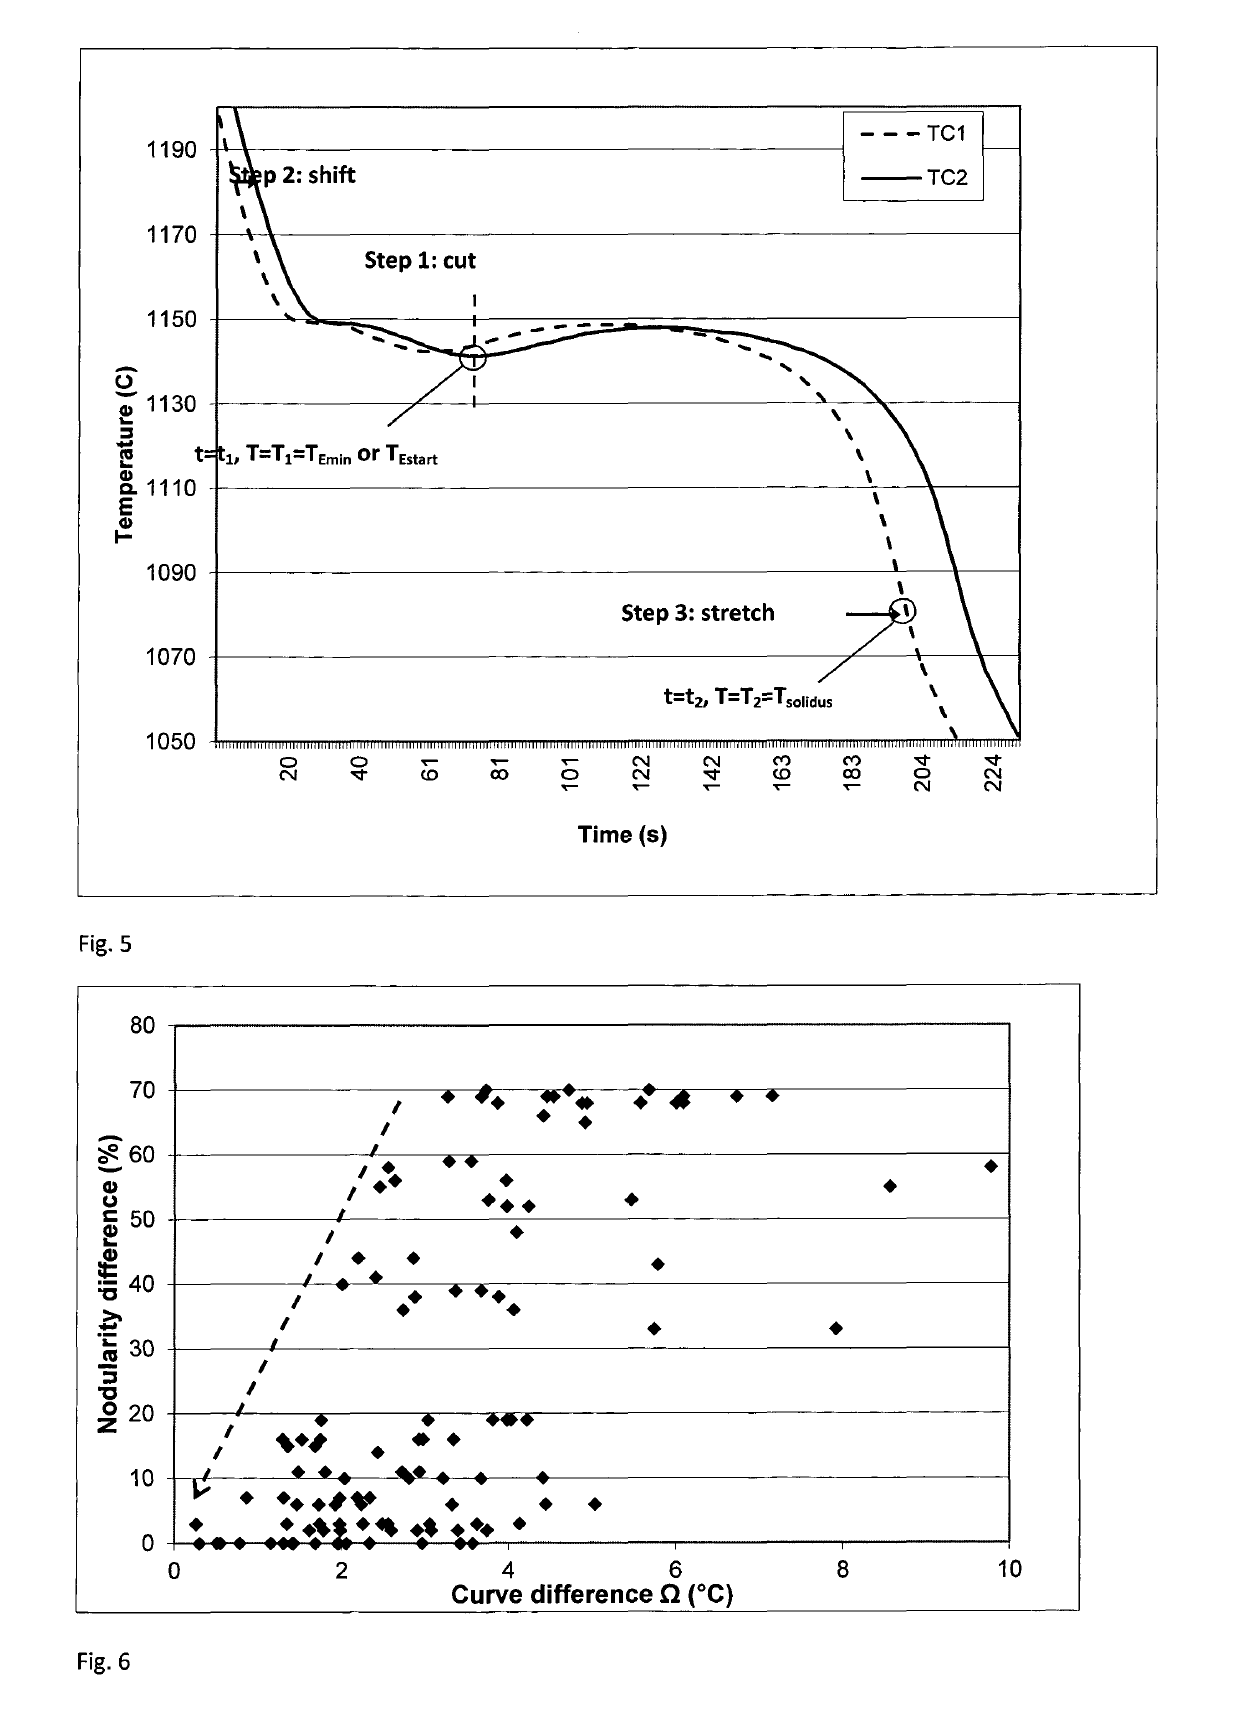
[0013]According to a preferred embodiment of said second aspect of the invention, the comparison on which the nodularity is predicted is performed along each of said curves for a time interval t1−t2 corresponding to a temperature interval T1−T2, where T1 is in the range of TEstart−TEmin, where TEstan is the temperature of beginning formation of graphite in the melt and TEmin is a minimum temperature before start of recalescence in the melt, and T2 is in the range of Tsolidus−(Tsolidus−20° C.), and that other time intervals in said curves are excluded from said comparison. Accordingly this is a combination of the first aspect and the second aspect. By the combination thereof, variations in the carbon equivalent as well as in the thermal cup filling ratio are compensated for in the analysis, and detrimental effects on a calculated Ω value caused by such variations are avoided.
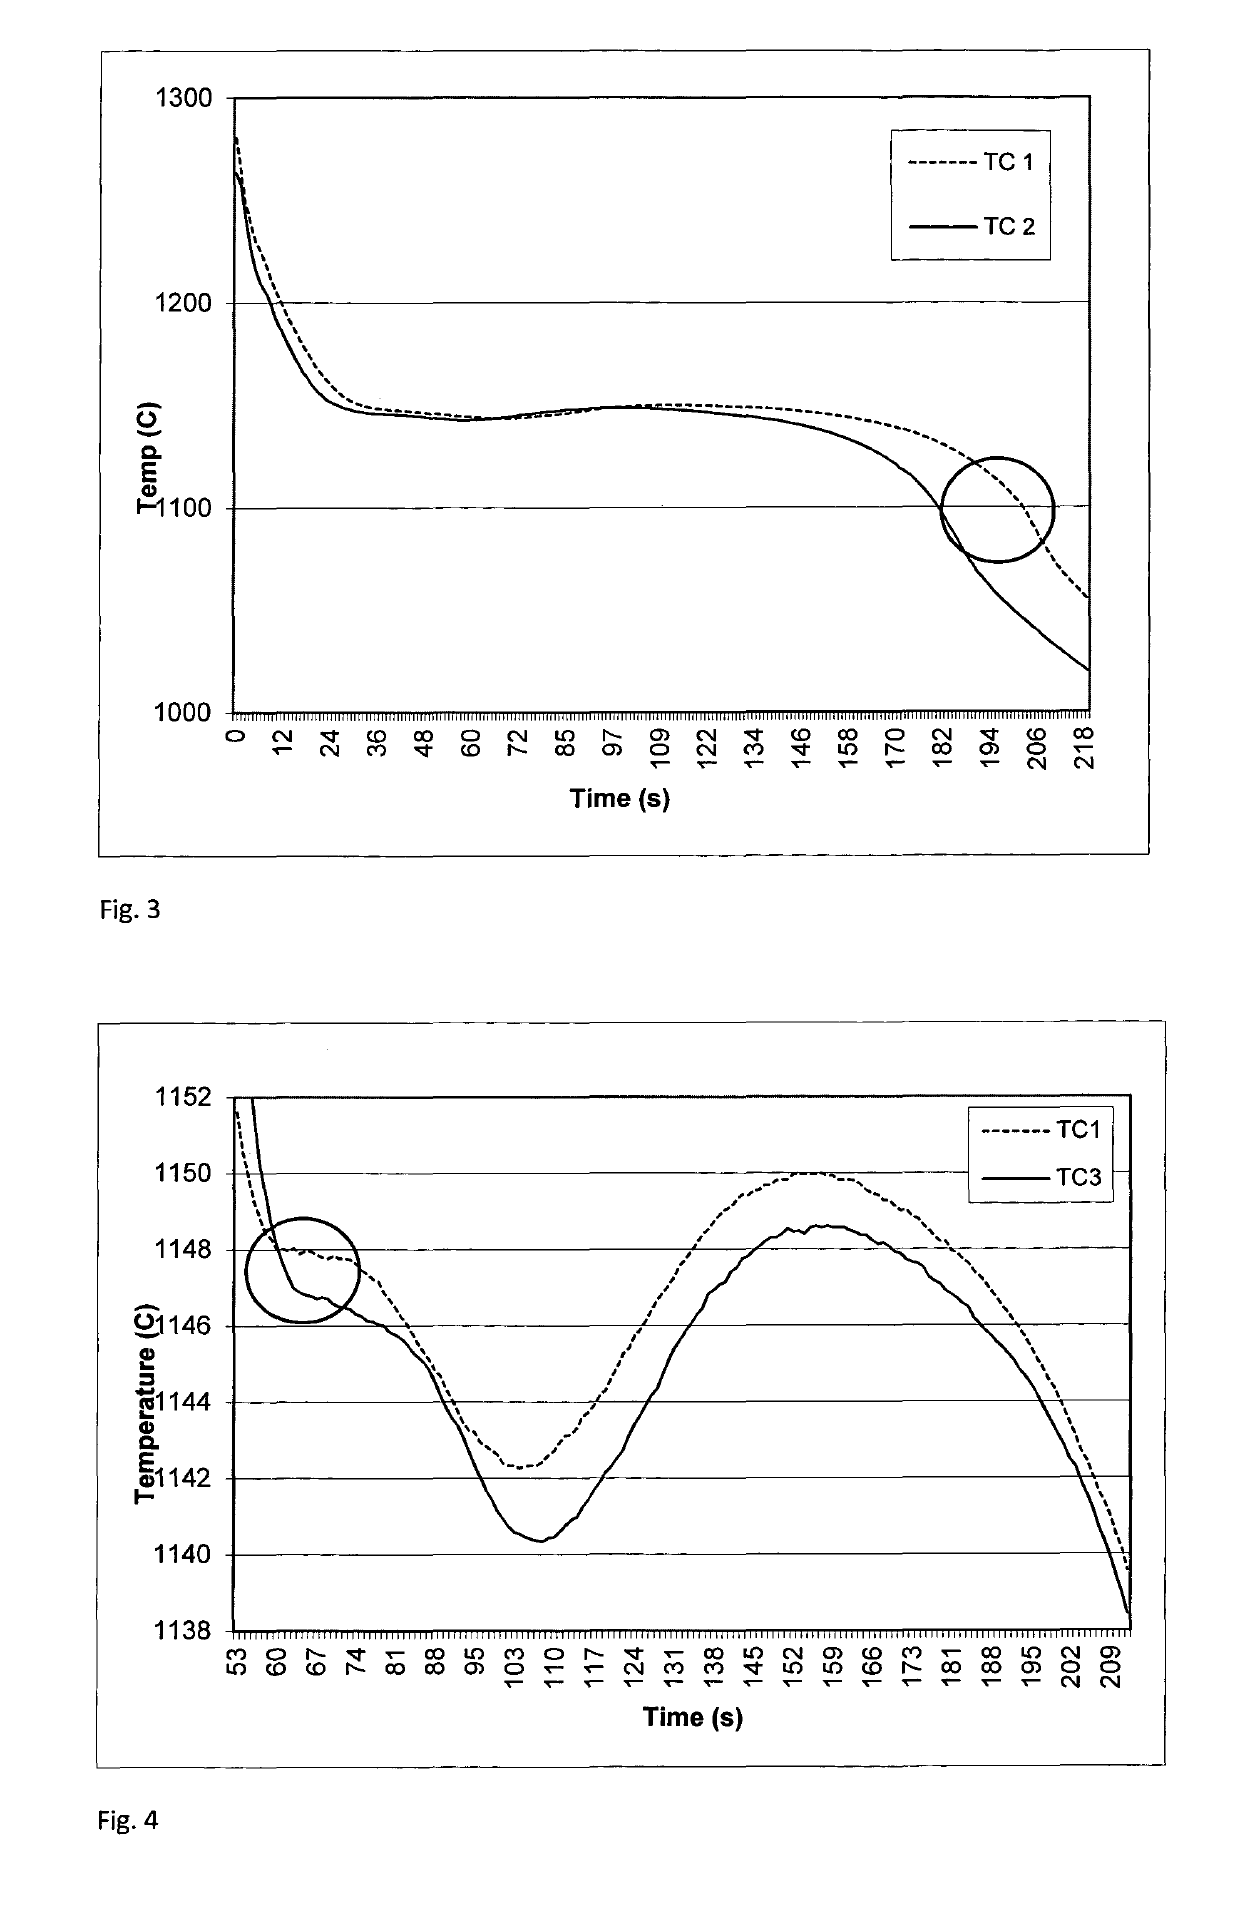
[0015]According to one embodiment, T1 is TEmin—The advantage of choosing this point as the starting point of the comparison interval is that it is reasonably easy to detect in the plotted curve and that, up to that point, possible differences between the plotted curve of the analysed melt and of any reference melt is of less importance to the prediction of the nodularity, as already described above.
[0016]According to yet another embodiment, T1 is TEstart—It should be mentioned that TEstart is in reality very close to TEmin as seen along the time axis in the plotted curve. Thus, the technical effect in terms of suppression of the effect of variations in carbon equivalent is not so different from that of having TEmin as a starting point. Likewise to TEmin, also TEstart has the advantage of being relatively easy to detect on a typical thermal analysis curve for a cast iron. TEstart is a defined by a local minimum in the first order derivative of the temperature, and by the second order derivative thereof being zero, i.e. defining a point of inflexion. By means of polynomial-adapted data, this inflexion point is relatively easy to detect.
[0020]According to one embodiment said melt consists of, in mass %:C 3.0-4.0 preferably 3.55-3.80Si 1.8-4.0 preferably 1.9-2.2Cu 0-1.0 preferably 0.8-1.0Mo 0-0.3Mn 0.3-0.5P 0-0.03S 0.006-0.015Sn 0.04-0.07Cr 0-0.10Tl 0-0.015Mg 0.005-0.020 preferably 0.008-0.015Ni 0-0.05balance Fe and unavoidable impurities.Melts with such a composition are advantageous for the purpose of producing a compacted graphite iron with nodularity and further mechanical properties that will be acceptable and advantageous for many applications.

Problems solved by technology

For example, graphite nodularity after magnesium treatment is affected by low initial sulfur level and this in turn may lead to nodular graphite formation at lower residual magnesium in the treated iron.
The content of oxygen is, on the other hand, not so easy to control or to monitor.
Therefore, there will always be a certain degree of uncertainty of how much magnesium that will be required in order to obtain a specific nodularity.
It has been found that the contribution to a (value from differences between different castings for the time range after that Tsolidus has been reached do not give any particular improvement of the analysis result but may rather have a negative impact thereon.

Method used


Image

  • Method of analyzing an iron melt
  • Method of analyzing an iron melt
  • Method of analyzing an iron melt

Examples


examples

[0060]Melts with the compositions according to table 1 (in mass %) were prepared in an induction furnace of medium frequency type with a melting capacity of 4 ton. The melts were inoculated with 0.1% Inobar and 0.02% RE (rare earth). The composition of the respective melt was measured by means of a spectrometer. Cekv is the carbon equivalent of the respective melt, expressed as CE=% C+% Si / 4+% P / 2.

[0061]

TABLE 1Trial No.CSiMnPSCrNiMoCuSnTiMgCekv13.672.200.380.0050.0090.030.020.010.960.0590.020.0094.2223.602.280.360.0060.0100.030.020.010.910.0560.0220.0104.3733.612.220.360.0050.0080.030.020.010.920.0610.0220.0084.1743.722.220.400.0050.0110.030.020.010.960.0590.020.0104.2753.692.250.350.0050.0110.030.020.010.940.0620.020.0094.1563.622.230.380.0060.0100.040.020.010.940.0590.020.0094.1873.692.230.370.0060.0090.030.020.010.960.0610.020.0124.2583.652.280.380.0060.0100.040.020.010.930.0600.0230.0124.2193.682.260.380.0060.0100.040.020.010.930.0600.0220.0124.21113.712.020.380.0070.0110.040.02...


PUM

PropertyMeasurementUnit
thicknessaaaaaaaaaa
temperatureaaaaaaaaaa
timeaaaaaaaaaa

Abstract

A method of analyzing an iron melt for producing compacted graphite iron includes receiving thermal data from cooling of a cast melt including a predetermined amount of carbon, magnesium, balance iron and unavoidable impurities, plotting the temperature of the cast melt against time such that a plotted time-temperature curve is generated, comparing the generated plotted curve to at least one reference curve, the reference curve representing a corresponding thermal analysis of another melt, the resulting nodularity of which is known, for the purpose of predicting the nodularity of the cast melt on basis of the difference between the curves. The comparison on which the nodularity is predicted is performed along each of the curves for a time interval t1−t2 corresponding to a temperature interval T1−T2, where T1 is in the range of TEstart−TEmin where TEstart is the temperature of beginning formation of graphite in the melt and TEmin is a minimum temperature before start of eutectic recalescence in the melt, and T2 is in the range of Tsolidus−(Tsolidus−20° C.), and other time intervals in the curves are excluded from the comparison.

Description

BACKGROUND AND SUMMARY[0001]The present invention relates to a method of analyzing an iron melt for producing compacted graphite iron, comprising the steps of: receiving thermal data from cooling of a casted melt comprising a predetermined amount of carbon, magnesium, balance iron and unavoidable impurities, plotting the temperature of the cast melt against time such that a plotted time-temperature curve is generated, and comparing the generated plotted curve to at least one reference curve, said reference curve representing a corresponding thermal analysis of another melt, the resulting nodularity of which is known, for the purpose of predicting the nodularity of the cast melt on basis of the difference between said curves.[0002]The present invention also relates to a method of producing compacted graphite iron, comprising the steps of: providing a melt comprising a predetermined amount of carbon, magnesium, balance iron and unavoidable impurities, casting at least a part of the me...

Claims


Application Information

Patent Timeline
Patent Type & Authority Patents(United States)
IPC IPC(8): G01N25/04G01N33/20
CPCG01N25/04G01N33/205
Inventor HOOSHYAR, HAMED HOSEINISCHMIDT, PAL
Owner VOLVO LASTVAGNAR AB
Why Eureka
Try Eureka