
Dynamic tracer message logging based on bottleneck detection

a tracer message and bottleneck detection technology, applied in the direction of software maintainance/management, instruments, code compilation, etc., can solve the problems of performance penalty, performance impact of traditional logging mechanisms, and detrimental effect of application performance monitoring

Active Publication Date: 2019-09-17
CHICAGO MERCANTILE EXCHANGE INC
View PDF36 Cites 1 Cited by
  • Summary
  • Abstract
  • Description
  • Claims
  • Application Information

AI Technical Summary

Benefits of technology

This approach enhances the monitoring system's performance by reducing the performance penalty and improving diagnostic capabilities without sacrificing data quality, allowing for more granular monitoring without impacting the monitored system's performance.

Problems solved by technology

Traditional logging mechanisms generally impact the performance of the underlying application being monitored.
In other words, monitoring an application, which is typically done to improve application performance, can have a detrimental effect on the performance of the application being monitored, i.e., a performance penalty.
The monitoring, which may adversely impact the application being monitored, may include one or more of collecting data, recording the data, and / or reviewing the data.
The number of checkpoints from which data is recorded, or that trigger a monitoring system to record data as messages traverse the checkpoints, in an application improves the granularity or resolution about the performance of messages through that application, but also contribute to the performance penalty of the monitoring system, because each checkpoint may increase the amount of processing power / computing resources required by the monitoring system, and may also increase the storage requirements for the data store where collected / logged data is recorded.
The performance of the monitoring threads / processes may adversely impact the performance of the system because those processes / threads typically use the same resources, e.g. processor / CPU, memory, etc., as the system being monitored.
Reducing, e.g., disabling, checkpoints from an application, where a monitoring system records data based on the checkpoints, accordingly, reduces a performance penalty of the monitoring system.
However, such sampling can result in lower precision metrics and less useful data.
However, messages, whether MBO or MBP, generated responsive to market impacting events which are caused by more than one order, such as a trade, may require the transmission of a significant amount of data to convey the requisite information to the market participants.
In addition, it may be appreciated that electronic trading systems further impose additional expectations and demands by market participants as to transaction processing speed, latency, capacity and response time, while creating additional complexities relating thereto.
In those markets, the failure of one participant can have a ripple effect on the solvency of the other participants.
Conversely, CME's mark-to-the-market system does not allow losses to accumulate over time or allow a market participant the opportunity to defer losses associated with market positions.
As an intermediary to electronic trading transactions, the exchange bears a certain amount of risk in each transaction that takes place.
This may result in penalizing the trader who makes an errant trade, or whose underlying trading motivations have changed, and who cannot otherwise modify or cancel their order faster than other traders can submit trades there against.
Furthermore, while it may be beneficial to give priority to a trader who is first to place an order at a given price because that trader is, in effect, taking a risk, the longer that the trader's order rests, the less beneficial it may be.
However, a trader who took a risk by being first to place an order (a “market turning” order) at a price may end up having to share an incoming order with a much later submitted order.
This results in an escalation of quantities on the order book and exposes a trader to a risk that someone may trade against one of these orders and subject the trader to a larger trade than they intended.
In the typical case, once an incoming order is allocated against these large resting orders, the traders subsequently cancel the remaining resting quantity which may frustrate other traders.
Oil refineries may trade a crack spread to hedge the price risk of their operations, while speculators attempt to profit from a change in the oil / gasoline price differential.
However, identifying implied opportunities may be computationally intensive.
The creation of implied orders increases the number of tradable items, which has the potential of attracting additional traders.
In some cases, the outright market for the deferred month or other constituent contract may not be sufficiently active to provide market data (e.g., bid-offer data) and / or trade data.
If any one of the queues or components of the transaction processing system experiences a delay, that creates a backlog for the structures preceding the delayed structure.
For example, if the match or transaction component is undergoing a high processing volume, and if the pre-match or pre-transaction queue is full of messages waiting to enter the match or transaction component, the conversion component may not be able to add any more messages to the pre-match or pre-transaction queue.
It should be appreciated that it may not be feasible or desirable to analyze the tracer entry data stored in the log file until a later time, e.g., when the system is no longer accepting messages.
For example, if the monitoring system is implemented in an exchange computing system, the logged data may not be reviewed for performance analysis until the end of the trading day, after the exchange computing system stops accepting new messages.
Thus, while the data store is recording information about the plurality of messages, it may not be efficient for an analysis tool to read the recorded data, for performance analysis of messages within the code.
Thus, disabling a checkpoint reduces an amount of data stored in the data store.
Additionally, the illustrations are merely representational and may not be drawn to scale.

Method used


Image

  • Dynamic tracer message logging based on bottleneck detection
  • Dynamic tracer message logging based on bottleneck detection
  • Dynamic tracer message logging based on bottleneck detection

Examples


example users

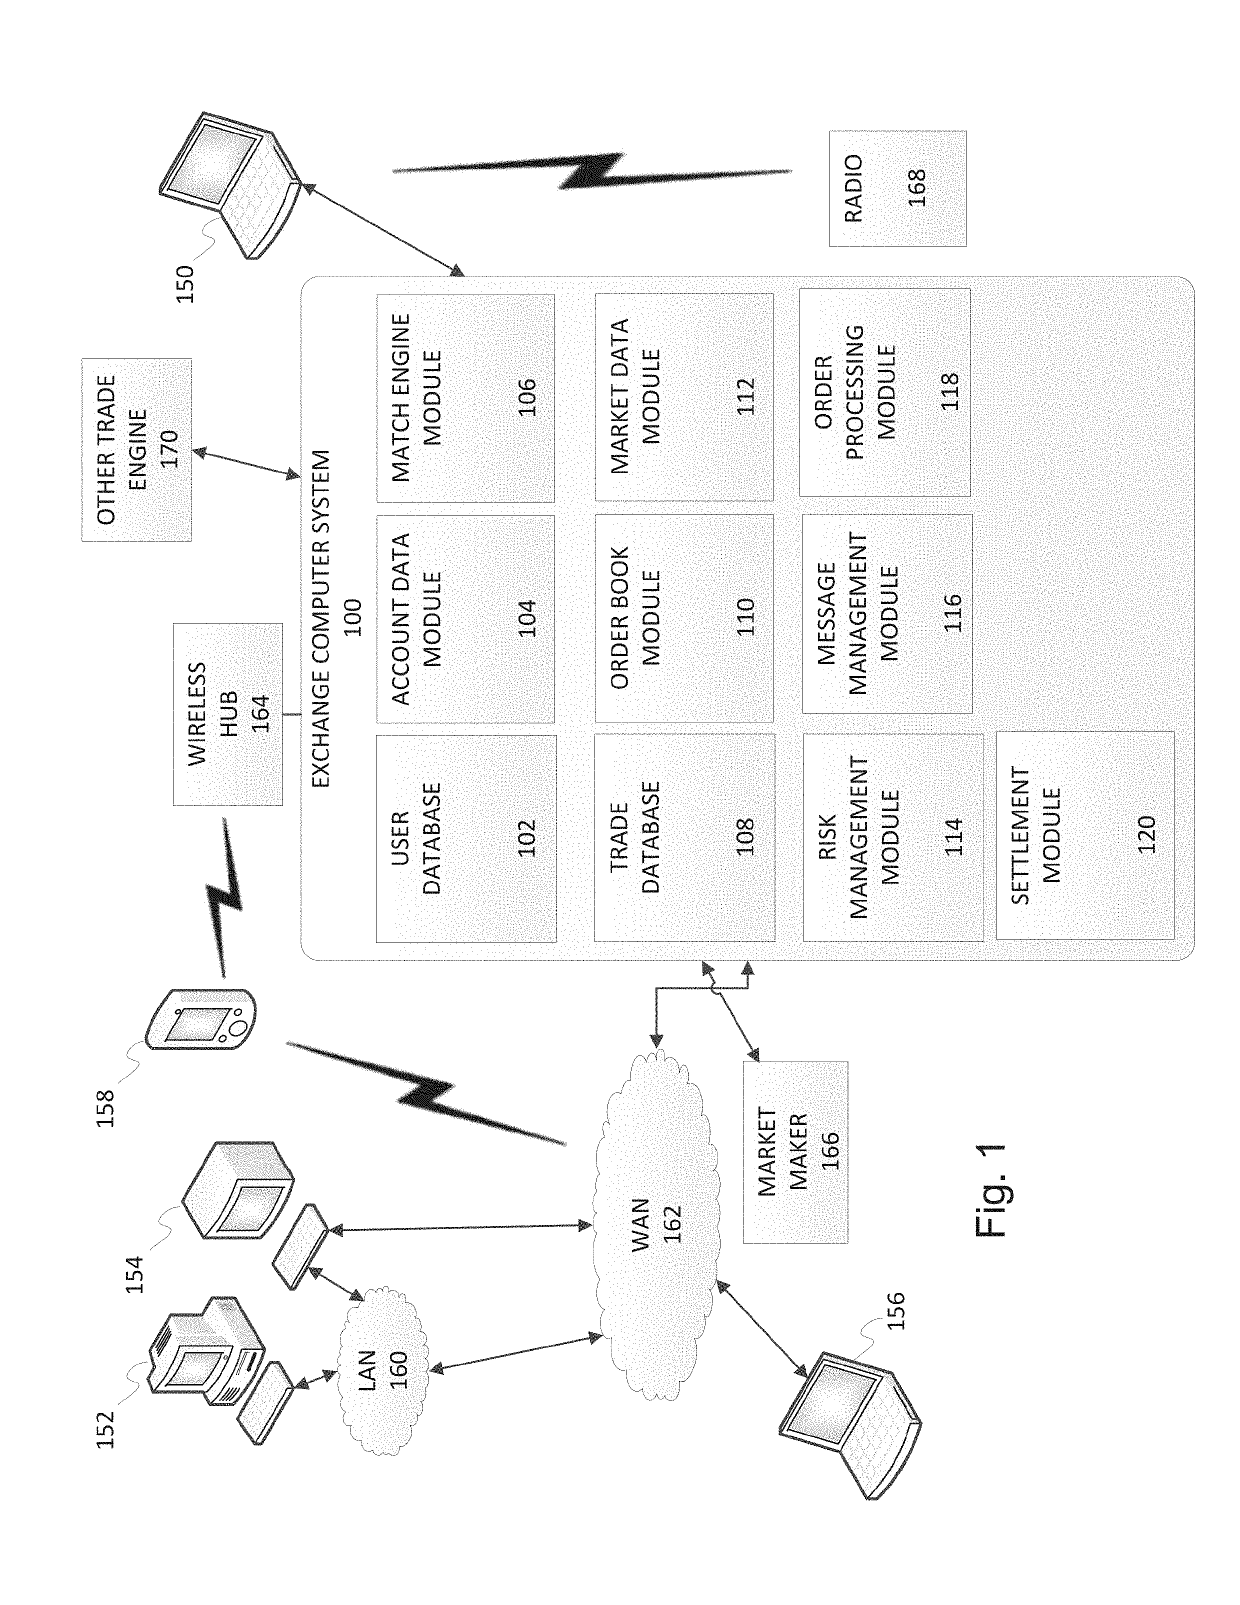
[0134]Generally, a market may involve market makers, such as market participants who consistently provide bids and / or offers at specific prices in a manner typically conducive to balancing risk, and market takers who may be willing to execute transactions at prevailing bids or offers may be characterized by more aggressive actions so as to maintain risk and / or exposure as a speculative investment strategy. From an alternate perspective, a market maker may be considered a market participant who places an order to sell at a price at which there is not a previously or concurrently provided counter order. Similarly, a market taker may be considered a market participant who places an order to buy at a price at which there is a previously or concurrently provided counter order. A balanced and efficient market may involve both market makers and market takers, coexisting in a mutually beneficial basis. The mutual existence, when functioning properly, may facilitate liquidity in the market s...


PUM


Abstract

A monitoring system monitors processing of incoming messages by an application, and logs data related to performance of the application. The application includes a plurality of checkpoints, and the monitoring system logs data upon each message traversing the checkpoints in the application. The monitoring system is configured to dynamically modify checkpoints within the application based on latency detection of portions of the application, resulting in improved granularity / resolution of the data collected from congested portions of the application, and reducing the performance penalty of the monitoring system from portions of the application that are not congested.

Description

BACKGROUND[0001]An application or code may include multiple processing stages, which may be sequential. Bottlenecks can form in different stages or portions of the code where, for example, processing occurs more slowly than the processing by one or more of the other processing stages, or otherwise takes longer than expected, delaying or preventing processing by those other processing stages. Application improvement typically focuses on reducing the largest bottlenecks, which yields the highest return on investment. Performance measurement systems monitor and record information about the operation of a system, such as by logging the progress of messages through an application or code, and can be used to further examine, study, and ultimately improve on bottlenecks in the code. Example information that is often logged / recorded by such systems includes data indicative of the occurrence of an event, such as when a processing of a particular message began or was completed by a particular...

Claims


Application Information

Patent Timeline
Patent Type & Authority Patents(United States)
IPC IPC(8): G06F11/36G06F8/41G06F8/70G06F11/34
CPCG06F8/443G06F11/3466G06F11/3476G06F11/3612G06F11/3409G06F8/70G06F11/3636G06F2201/81
Inventor KAVANAGH, KYLE DENNISACUÑA-ROHTER, JOSÉ ANTONIOWONG, DAVID MICHAEL
Owner CHICAGO MERCANTILE EXCHANGE INC
Learn More