Method for quantification of purity of sub-visible particle samples

a technology of visible particles and quantification methods, which is applied in the direction of material analysis using wave/particle radiation, instruments, nanoparticle analysis, etc., can solve the problems of inaccurate quantitative assessing of purity currently available methods, and achieve the effect of effective and reliabl

Active Publication Date: 2019-10-22
INTELLIGENT VIRUS IMAGING
View PDF1 Cites 2 Cited by
  • Summary
  • Abstract
  • Description
  • Claims
  • Application Information

AI Technical Summary

Benefits of technology

[0005]In another embodiment, the edges of objects in the image are enhanced and the objects have a size that is substantially similar to a size range of primary particles. A roundness of the objects is analyzed to identify primary particles.
[0007]In another embodiment, the edges of objects in the image are enhanced and the objects have a size that is substantially similar to a size range of primary particles and a radial density profile of the objects is analyzed to identify primary particles.
[0008]In yet another embodiment, the edges of objects in the image are enhanced and the objects have a size that is substantially similar to a size range of primary particles, and a signal-to-noise ratio at the border of the objects are analyzed by measuring an average intensity of an interior of the objects compared to an average intensity just outside the objects.
[0009]In another embodiment, the edges of objects in the image are enhanced and the objects have a size that is substantially similar to a size range of primary particles and a local contrast of the objects are measured by analyzing a sharpness of an outer edge of the objects.
[0010]In another embodiment, the edges of objects in the image are enhanced and the objects have a size that is substantially similar to a size range of primary particles and the structure of the objects is measured by means of texture analysis to identify primary particles.

Problems solved by technology

However, the currently available methods for quantitatively assessing the purity are not very accurate and often involve manual steps that may distort the final result.

Method used


Image

  • Method for quantification of purity of sub-visible particle samples
  • Method for quantification of purity of sub-visible particle samples
  • Method for quantification of purity of sub-visible particle samples

Examples


Embodiment Construction

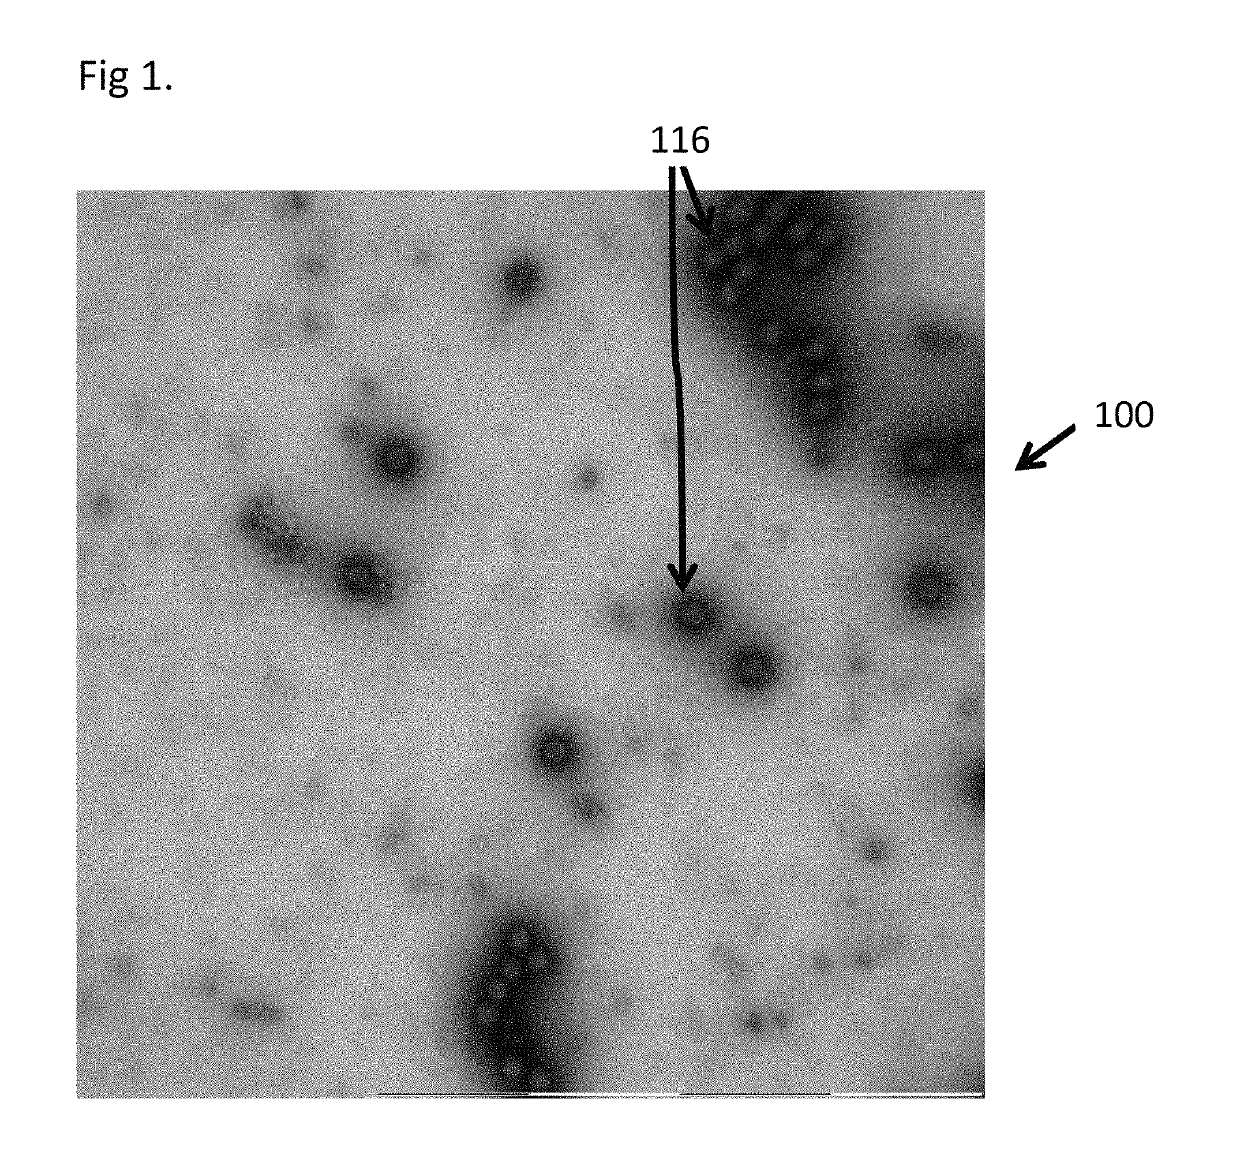
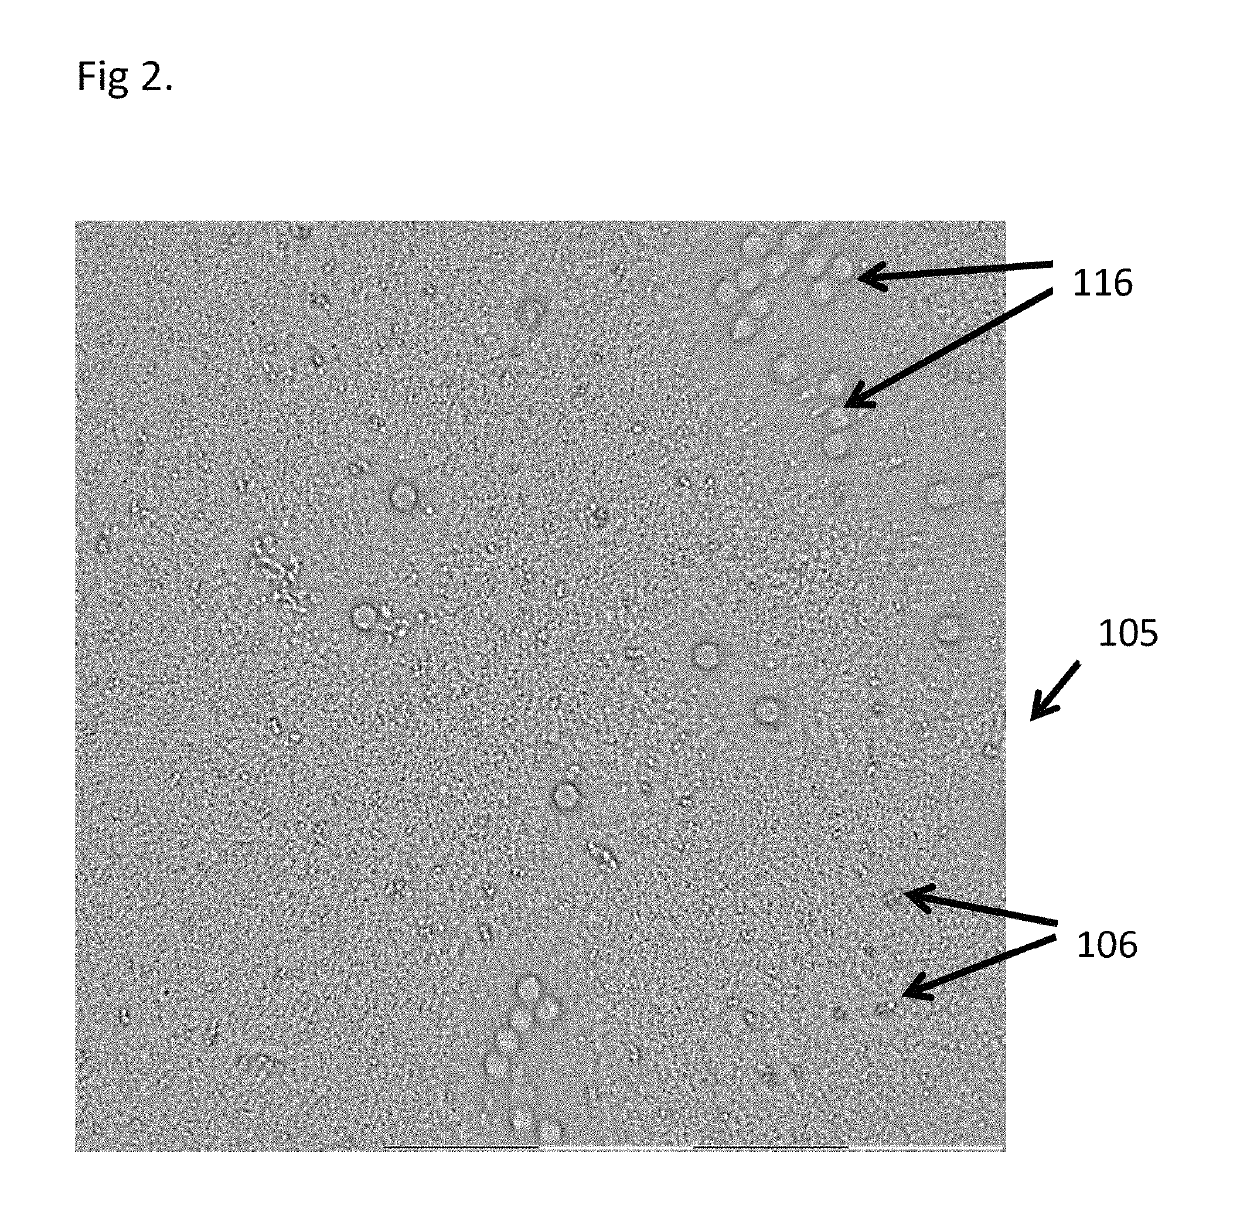
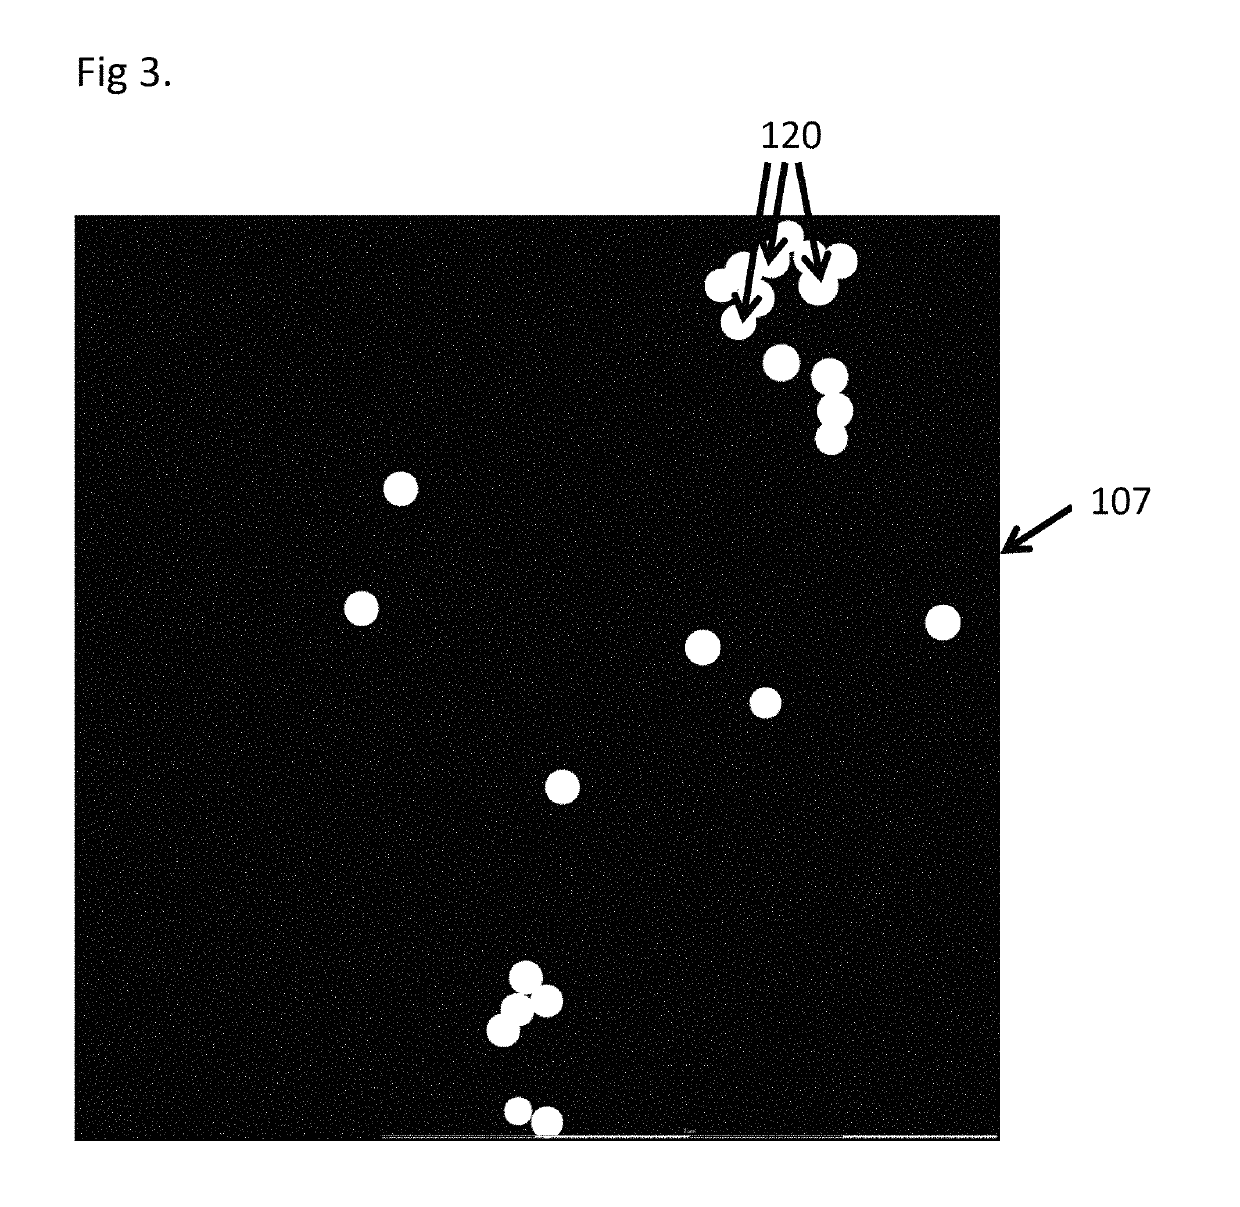
[0021]The present invention describes a unique method for quantitatively measuring the purity of a sample containing sub-visible or nano-particles (that may, for example, have a size of about 100 nm) in solution based on an automatic and objective image analysis of electron microscopy images of the sample. The sample may, for example, be liquid, dissolved solid or powder samples.

[0022]Negative stain transmission electron microscopy images may be used. In general, the purity measure of the present invention is, preferably, the area ratio of primary particles to non-primary particles (including small debris as well as large debris clusters). The principle steps of the method of the present invention are:[0023]1. Placing a sample to be analyzed in an electron microscope to obtain an electron microscopy image of the sample;[0024]2. Enhancing edges (such as fine edges) of primary particles in the image that have a size that is typical for the primary particle;[0025]3. Specifically detect...


PUM

PropertyMeasurementUnit
sizeaaaaaaaaaa
purityaaaaaaaaaa
electron microscopeaaaaaaaaaa

Abstract

The method is for quantification of purity of sub-visible particle samples. A sample to be analyzed is place in an electron microscope to obtain an electron microscopy image of the sample. The sample contains objects. The objects that have sizes being different from a size range of primary particles and sizes being within the size range of primary particles are enhanced. The objects are detected as being primary particles or debris. The detected primary particles are excluded from the objects so that the objects contain debris but no primary particles. A first total area (T1) of the detected debris is measured. A second total area (T2) of the detected primary particles is measured.

Description

PRIOR APPLICATION[0001]This application is a U.S. national phase application based on International Application No. PCT / US17 / 50962, filed 11 Sep. 2017, claiming priority from U.S. Provisional Patent Application No. 62 / 402,003, filed 30 Sep. 2016.TECHNICAL FIELD[0002]The present invention relates to a method for assessing and quantitatively measuring how pure a sample is by using electron microscopy.BACKGROUND AND SUMMARY OF THE INVENTION[0003]Developing and producing biopharmaceuticals typically involve several purification steps where cell debris, broken particles, other contaminants and clusters etc. should be removed so that the final product contains only the desirable primary particles. The purity and dispersion of the primary particles of interest (i.e. non-clustered primary particles) in the final product is important for its quality and efficacy. To quantitatively assess the purity is hence of importance for the final product but also during the upstream development and prod...

Claims


Application Information

Patent Timeline
Patent Type & Authority Patents(United States)
IPC IPC(8): G01N23/04G01N15/10G06K9/00G01N15/00G01B15/00G01B21/28G01N15/14C12Q1/70G06V10/44
CPCG01N23/04C12Q1/70G01N15/1475G01B15/00G01N15/10G01B21/28G06K9/00127G01N2223/405G01N2015/1006G01N2223/401G01N2015/0038G01N2015/1093G06V20/698G06V10/44C12Q2565/601G06V20/69
Inventor SINTORN, IDA-MARIARYNER, MARTINKYLBERG, GUSTAFNILSSON, JOSEFINA
Owner INTELLIGENT VIRUS IMAGING
Why Eureka
Try Eureka