
Quantitative liquid texture measurement method

a quantitative and liquid texture technology, applied in the direction of testing food, analysing fluids using sonic/ultrasonic/infrasonic waves, instruments, etc., can solve the problems of insufficient consistency of texture experience of consumers, time-consuming and expensive sensory evaluation, and the measurement of the peak force exerted on a potato chip cannot adequately replicate the texture experienced by consumers

Active Publication Date: 2022-02-08
FRITO LAY NORTH AMERICA INC
View PDF149 Cites 0 Cited by
  • Summary
  • Abstract
  • Description
  • Claims
  • Application Information

AI Technical Summary

Benefits of technology

The present invention is a device and method for measuring the texture of liquids through the use of an energy excitation tool, an acoustic capturing device, and a data processing unit. The device generates an acoustic signal when a laser is directed at a liquid on a surface, and the signal is recorded and processed to create a quantitative model of the liquid's texture attributes, such as hardness, fracturability, or crispiness. This model is then used to measure the texture of the liquid, providing a more accurate and reliable means of texture analysis compared to traditional methods. The invention has various applications, such as in the analysis of snack foods, and is suitable for use in combination with other systems and methods.

Problems solved by technology

However, sensory evaluation is time-consuming and expensive, and therefore, reliable and practical instrumental methods are needed to accurately predict sensory texture attributes and other food snack properties.
A major challenge is how to accurately and objectively measure texture and mouthfeel for liquids and solids.
A problem with hardness is that their correlations with sensory tests are not always as high as expected.
In many instances, the metric of peak force exerted on a potato chip does not adequately replicate the texture experienced by consumers.
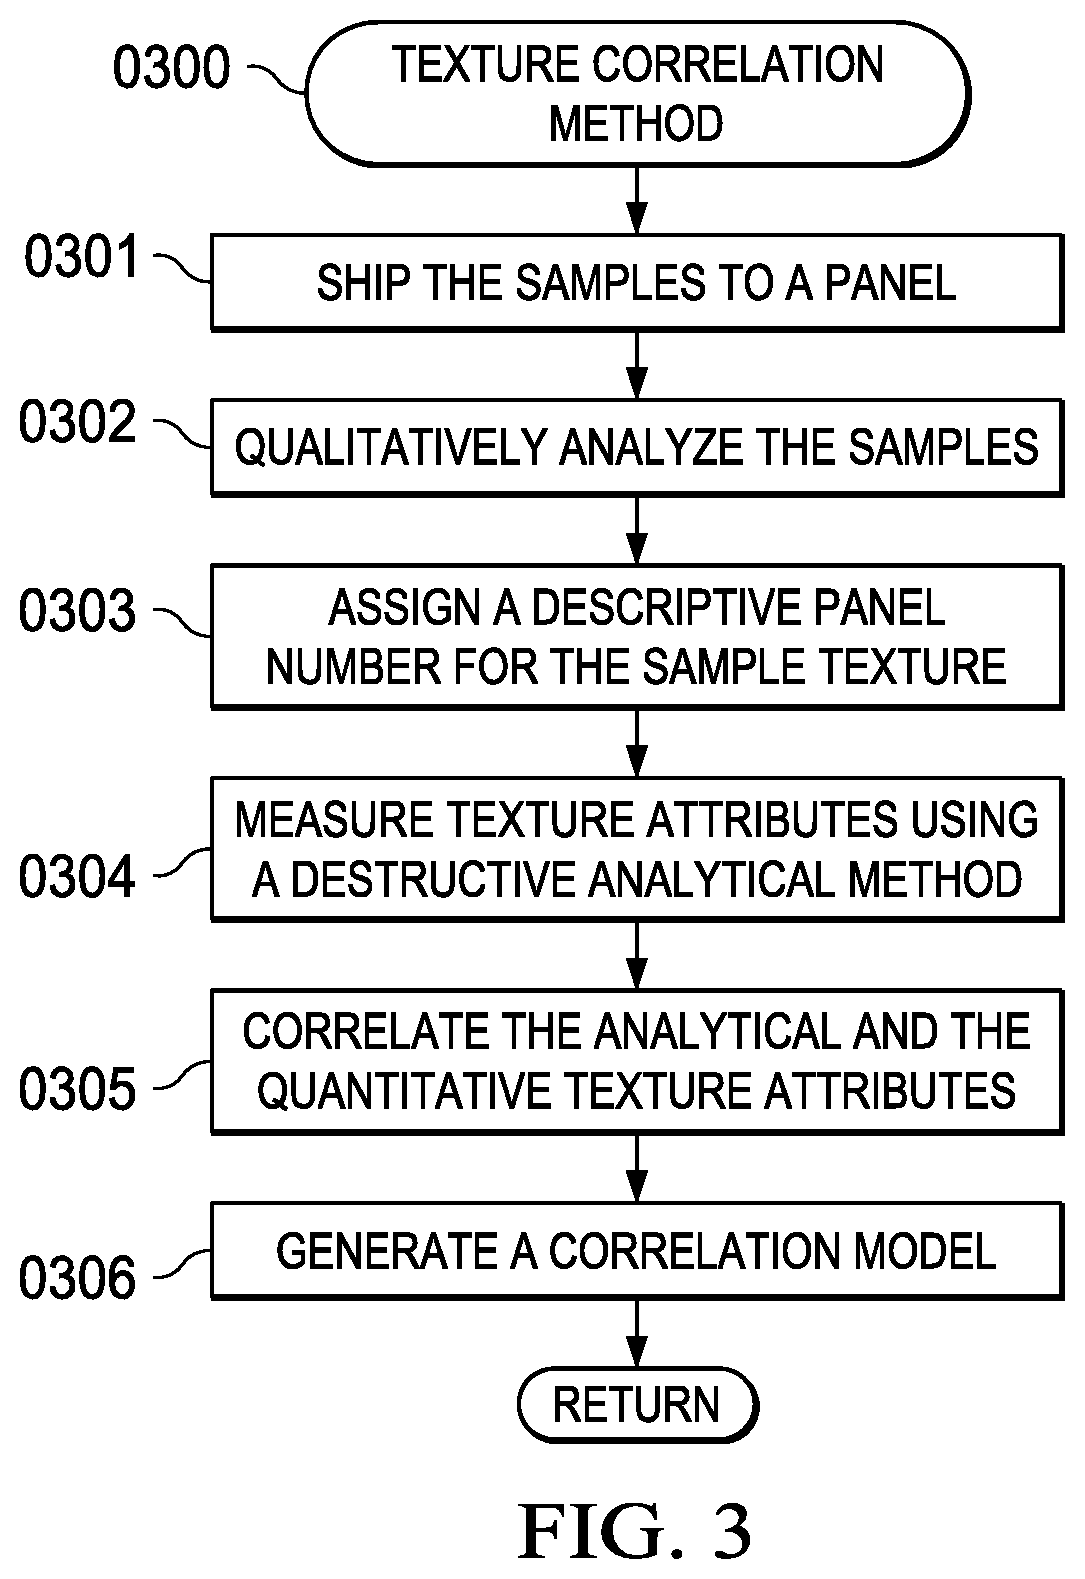
Presently, there is no good correlation of any type between instrument readings and taste panel scores.
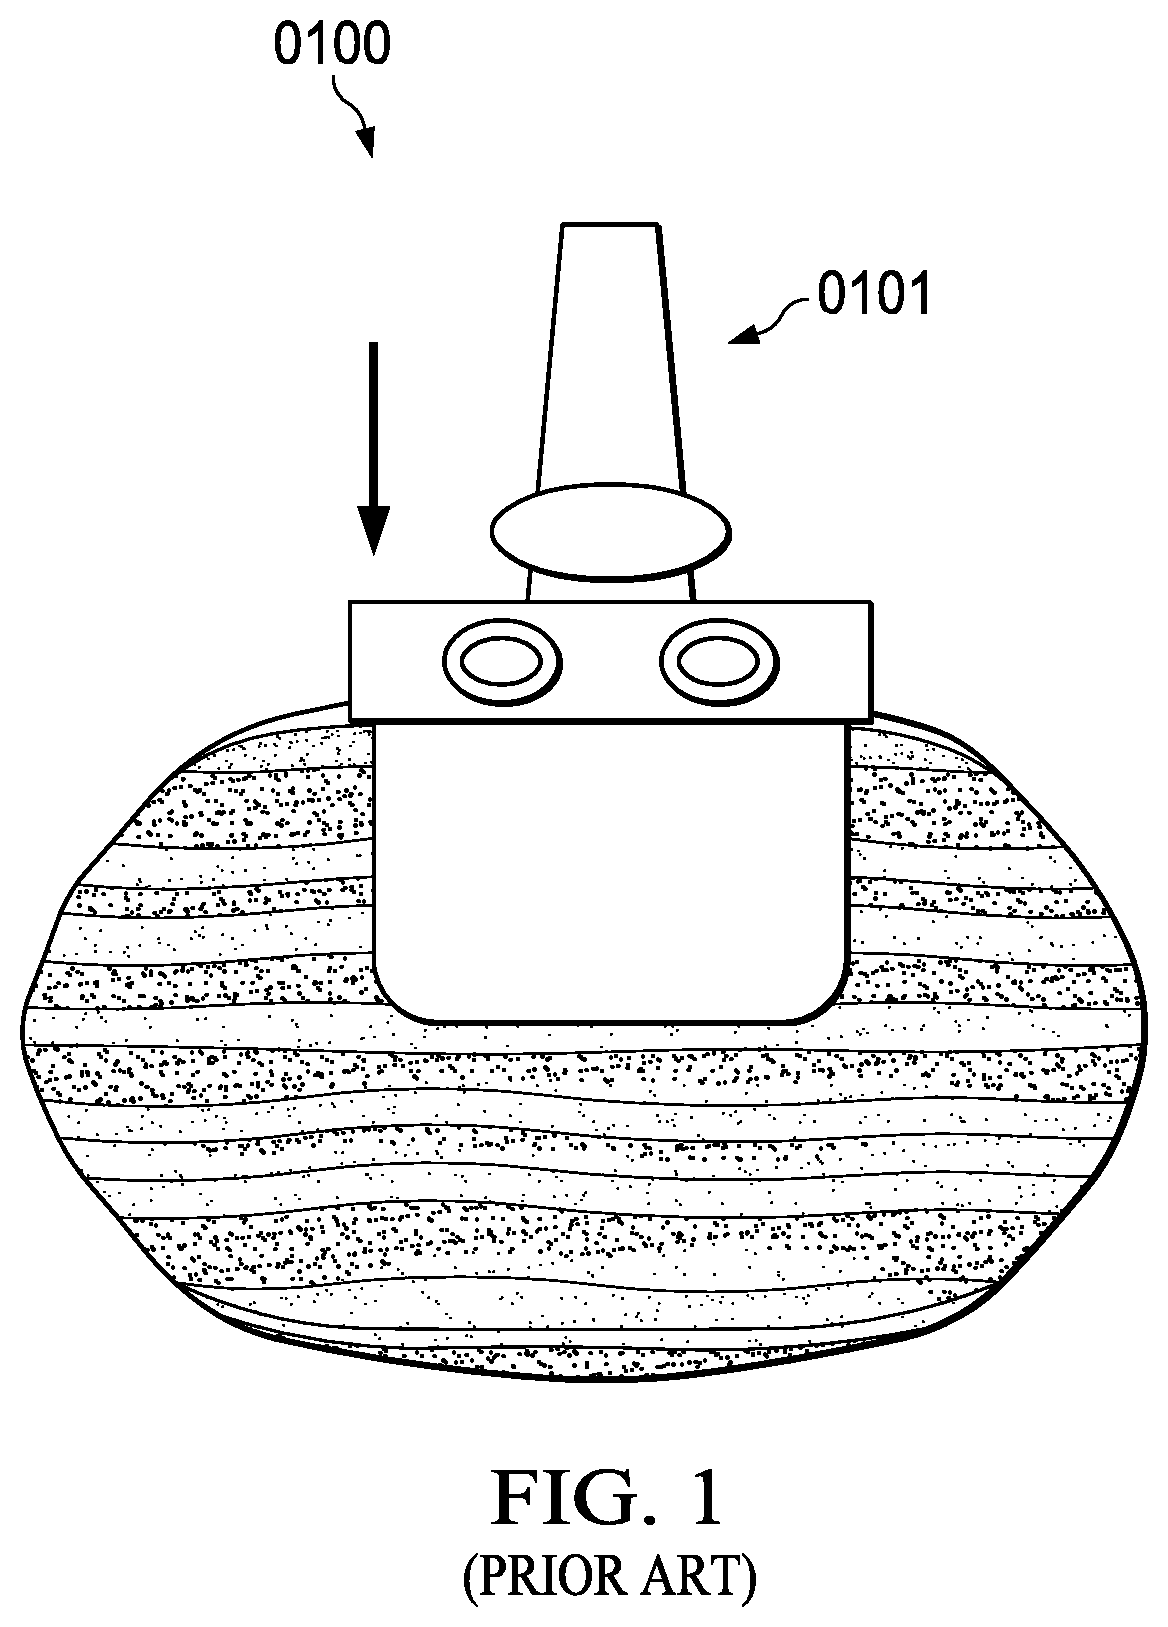
The issue is that no instrument is capable of manipulating a food product precisely the same way as the human mouth during mastication.
Complexity in tasting wine can mean many things.
However, there are currently no quantitative methods to measure the complex flavors in a wine.
If a wine is too sour, too sugary, too astringent, too hot (alcoholic), too bitter, or too flabby (lack of acid) then it is not a well-balanced wine.
However, there are currently no quantitative methods to measure the balance and other components in a wine.
Similar to wine tasting, current coffee tasting methods do not provide a quantitative method to measure coffee flavors and taste.
While the measurement have been of vital importance to the industry, they do not explain rheology the consumer experiences when the sample comes into contact with human saliva.
More specifically, current qualitative and quantitative measurements of beverage texture exhibit measurement errors that would require large sample sizes to achieve statistical significance.
As an example, differentiating sweeteners at the concentrations they are found in beverages in a rheological manner can prove to be very difficult; in other words to distinguish the viscosity of a Diet Pepsi® vs. a regular Pepsi® is difficult given the measurement error; however, when in contact with saliva, different sweeteners can have different interactions with human saliva given their chemical composition, the mixture of the beverage and the saliva produces viscosity differences that cannot be differentiated by current measurement methods.
Presently there is no good correlation of any type between instrument readings and taste panel scores.
Presently there are no instruments capable of manipulating a food product precisely the same way as the human mouth during mastication.
In fact, what an instrument measures may not relate at all to what the consumer perceives.

Method used


Image

  • Quantitative liquid texture measurement method
  • Quantitative liquid texture measurement method
  • Quantitative liquid texture measurement method

Examples


Embodiment Construction

[0086]While this invention is susceptible of embodiment in many different forms, there is shown in the drawings and will herein be described in detailed preferred embodiment of the invention with the understanding that the present disclosure is to be considered as an exemplification of the principles of the invention and is not intended to limit the broad aspect of the invention to the embodiment illustrated.

[0087]The numerous innovative teachings of the present application will be described with particular reference to the presently exemplary embodiment, wherein these innovative teachings are advantageously applied to quantitative measurement of texture attributes for food snacks apparatus and method. However, it should be understood that this embodiment is only one example of the many advantageous uses of the innovative teachings herein. In general, statements made in the specification of the present application do not necessarily limit any of the various claimed inventions. Moreo...


PUM

PropertyMeasurementUnit
wavelengthaaaaaaaaaa
diameteraaaaaaaaaa

Abstract

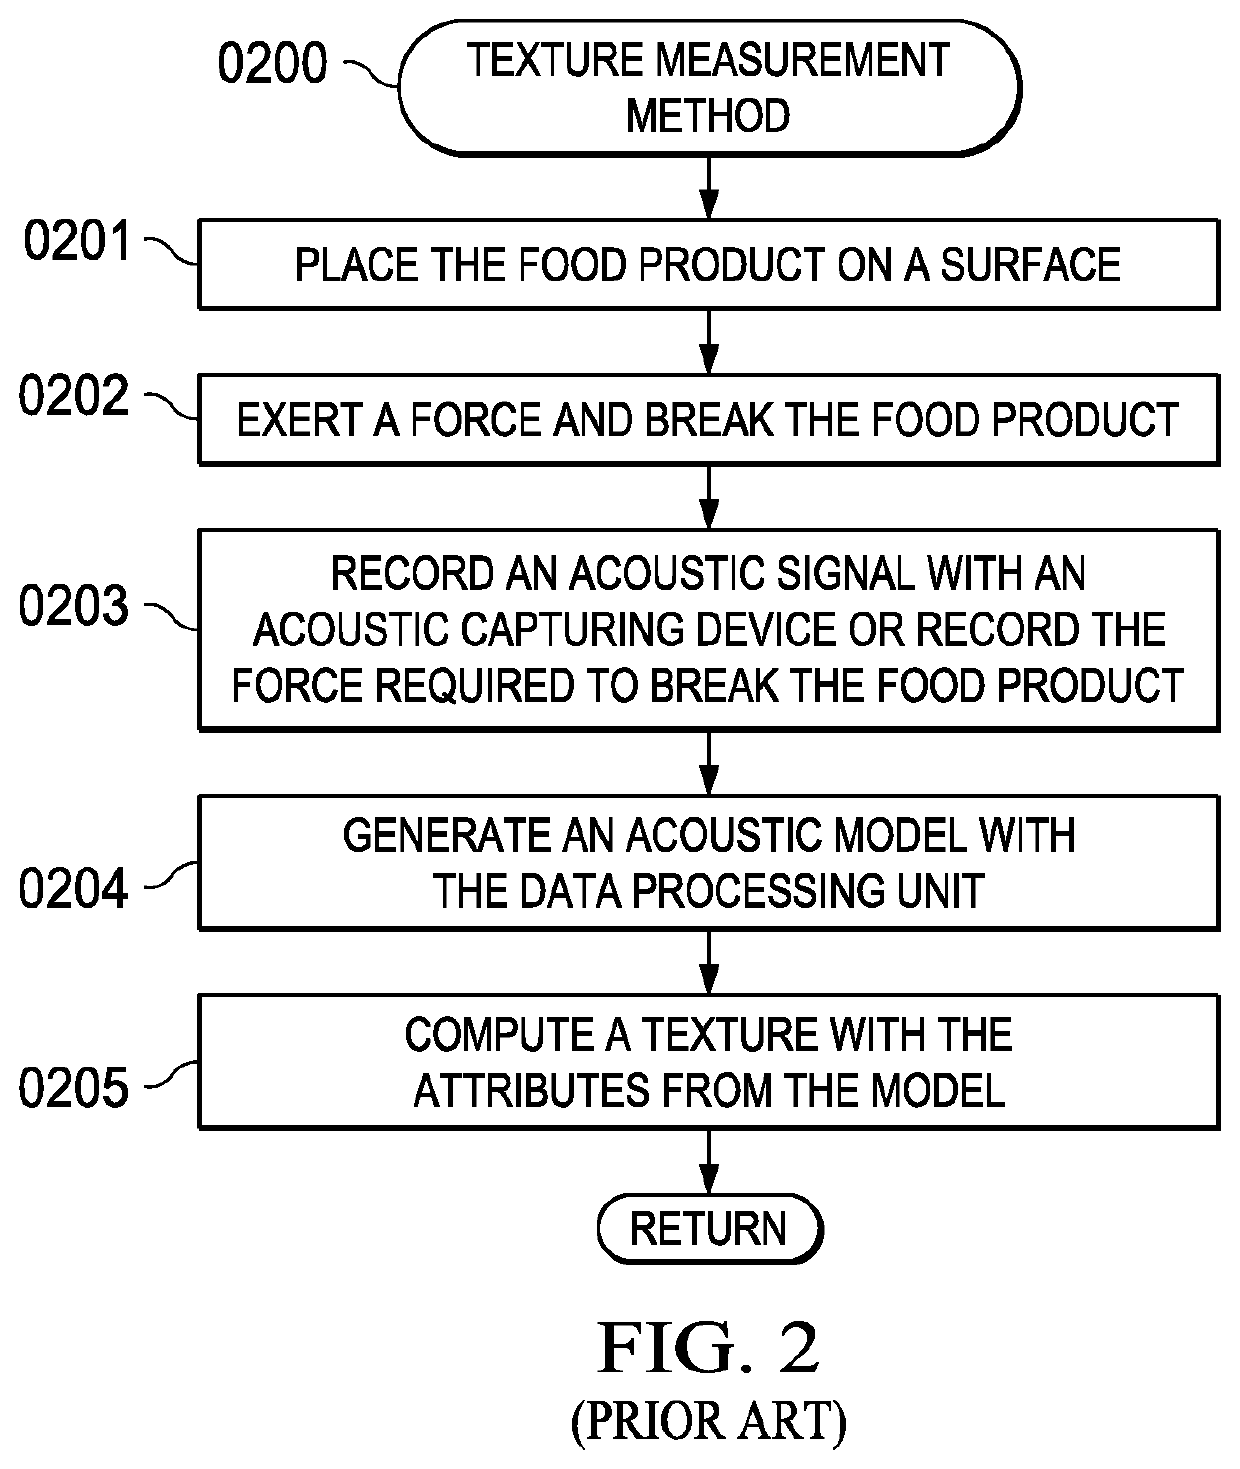
A photo acoustic non-destructive measurement apparatus and method for quantitatively measuring texture of a liquid. The apparatus includes a laser generating tool, an acoustic capturing device, and a data processing unit. The laser generating tool directs a laser towards a surface of a liquid contained in a container and creates pressure waves that propagate through the air and produce an acoustic signal. The acoustic capturing device records and forwards the signal to a data processing unit. The data processing unit further comprises a digital signal processing module that processes the received acoustic signal. A statistical processing module further filters the acoustic signal from the data processing unit and generates a quantitative acoustic model for texture attributes such as hardness and fracturability. The quantitative model is correlated with a qualitative texture measurement from a descriptive expert panel. Textures of liquids are quantitatively measured with the quantitative acoustic model.

Description

CROSS-REFERENCE TO RELATED APPLICATIONS[0001]This application is a continuation (CON) of U.S. application Ser. No. 16 / 132,830 filed Sep. 17, 2018, published Jan. 17, 2019, as US Publication No. 2019-0017972, which is a divisional (DIV) application of U.S. application Ser. No. 15 / 459,828 filed Mar. 15, 2017, published Jun. 29, 2017, as US Publication No. 2017-0184551, which in turn was a continuation-in-part (CIP) of U.S. application Ser. No. 15 / 380,622 filed Dec. 15, 2016, published Apr. 6, 2017, as US Publication No. 2017-0097324, and U.S. application Ser. No. 15 / 380,943 filed Dec. 15, 2016, published Apr. 6, 2017, as US Publication No. 2017-0097222, which are both continuation (CON) applications of U.S. application Ser. No. 14 / 864,593 filed Sep. 24, 2015, now U.S. Pat. No. 9,541,537 issued Jan. 10, 2017. All the applications, publications and patents listed in this paragraph are incorporated herein by reference in their entirety as examples.FIELD OF THE INVENTION[0002]The present ...

Claims


Application Information

Patent Timeline
Patent Type & Authority Patents(United States)
IPC IPC(8): G01N29/14G01N29/24G01N29/02G01N33/14G01N29/036G01N33/10G01H9/00
CPCG01N29/2418G01N29/02G01N29/036G01N33/10G01N33/14G01H9/008G01N2291/022G01N2291/02818G01N2291/02827
Inventor BAI, OUBOURG, JR., WILFRED MARCELLIENFAGAN, SCOTTMICHEL-SANCHEZ, ENRIQUEMIRZA, SHAHMEER ALIRICHARDSON, SCOTT G.SHAO, CHEN C.
Owner FRITO LAY NORTH AMERICA INC
Learn More