System and method of tumor classification

a tumor classification and tumor technology, applied in the field of image analysis, can solve the problems of increased tumor aggressiveness, increased tumor risk of death, and large amount of genetic variation identified and their interpretation, and achieve the effects of increasing the accuracy of predicting whether a particular drug class will be effective in treating the tumor, and increasing the accuracy of predicting the effect of a particular drug class

Active Publication Date: 2022-04-26
F HOFFMANN LA ROCHE & CO AG
View PDF5 Cites 0 Cited by
  • Summary
  • Abstract
  • Description
  • Claims
  • Application Information

AI Technical Summary

Benefits of technology

[0016]The high mutational load in MSI tumors creates many tumor-specific neoantigens, typically 10-50 times that of MSS tumors. Some of these neoantigens will be processed, presented on MHC, and recognized as foreign by T cells. The high neoantigen burden might be one explanation for the high level of tumor-infiltrating lymphocytes (“inflammatory tumor state”) in MSI tumors. MSI tumors have a better prognosis than MSS tumors and respond better to several classes of drugs which boost or modulate the immune response. By determining a proximity measure based on the individual distances of tumor cells and immune cells, a more accurate classification of inflammatory vs. non-inflammatory tumors can be made and / or a more accurate prognosis and treatment recommendation (whether or not to prescribe a drug that boosts or modulates the immune response) can be given.
[0122]Thus, the width of the boundary region around the tumor regions defines the area (tumor region(s) and tumor boundary region(s)) which shall be used for counting individual immune cell-tumor cell distances. Selectively identifying immune cells within the exterior outline of a boundary region around an identified tumor region may allow to ensure that the accuracy of the proximity measure is not negatively affected by including the immune cells that are normally distributed in tissue regions far away from a tumor which would never engage in an immune response against the tumor anyway. In addition, this may ensure that the accuracy of the proximity measure is not negatively affected by a too narrow boundary that would exclude immune cells in close proximity of the tumor whose position is key for predicting the inflammatory status of the tumor.

Problems solved by technology

However, one caveat of these studies remains the large amount of genetic variations identified and their interpretation.
High expression of PDL1 by tumor cells has been observed to be associated with increased tumor aggressiveness and an increased risk of death.

Method used


Image

  • System and method of tumor classification
  • System and method of tumor classification
  • System and method of tumor classification

Examples


Embodiment Construction

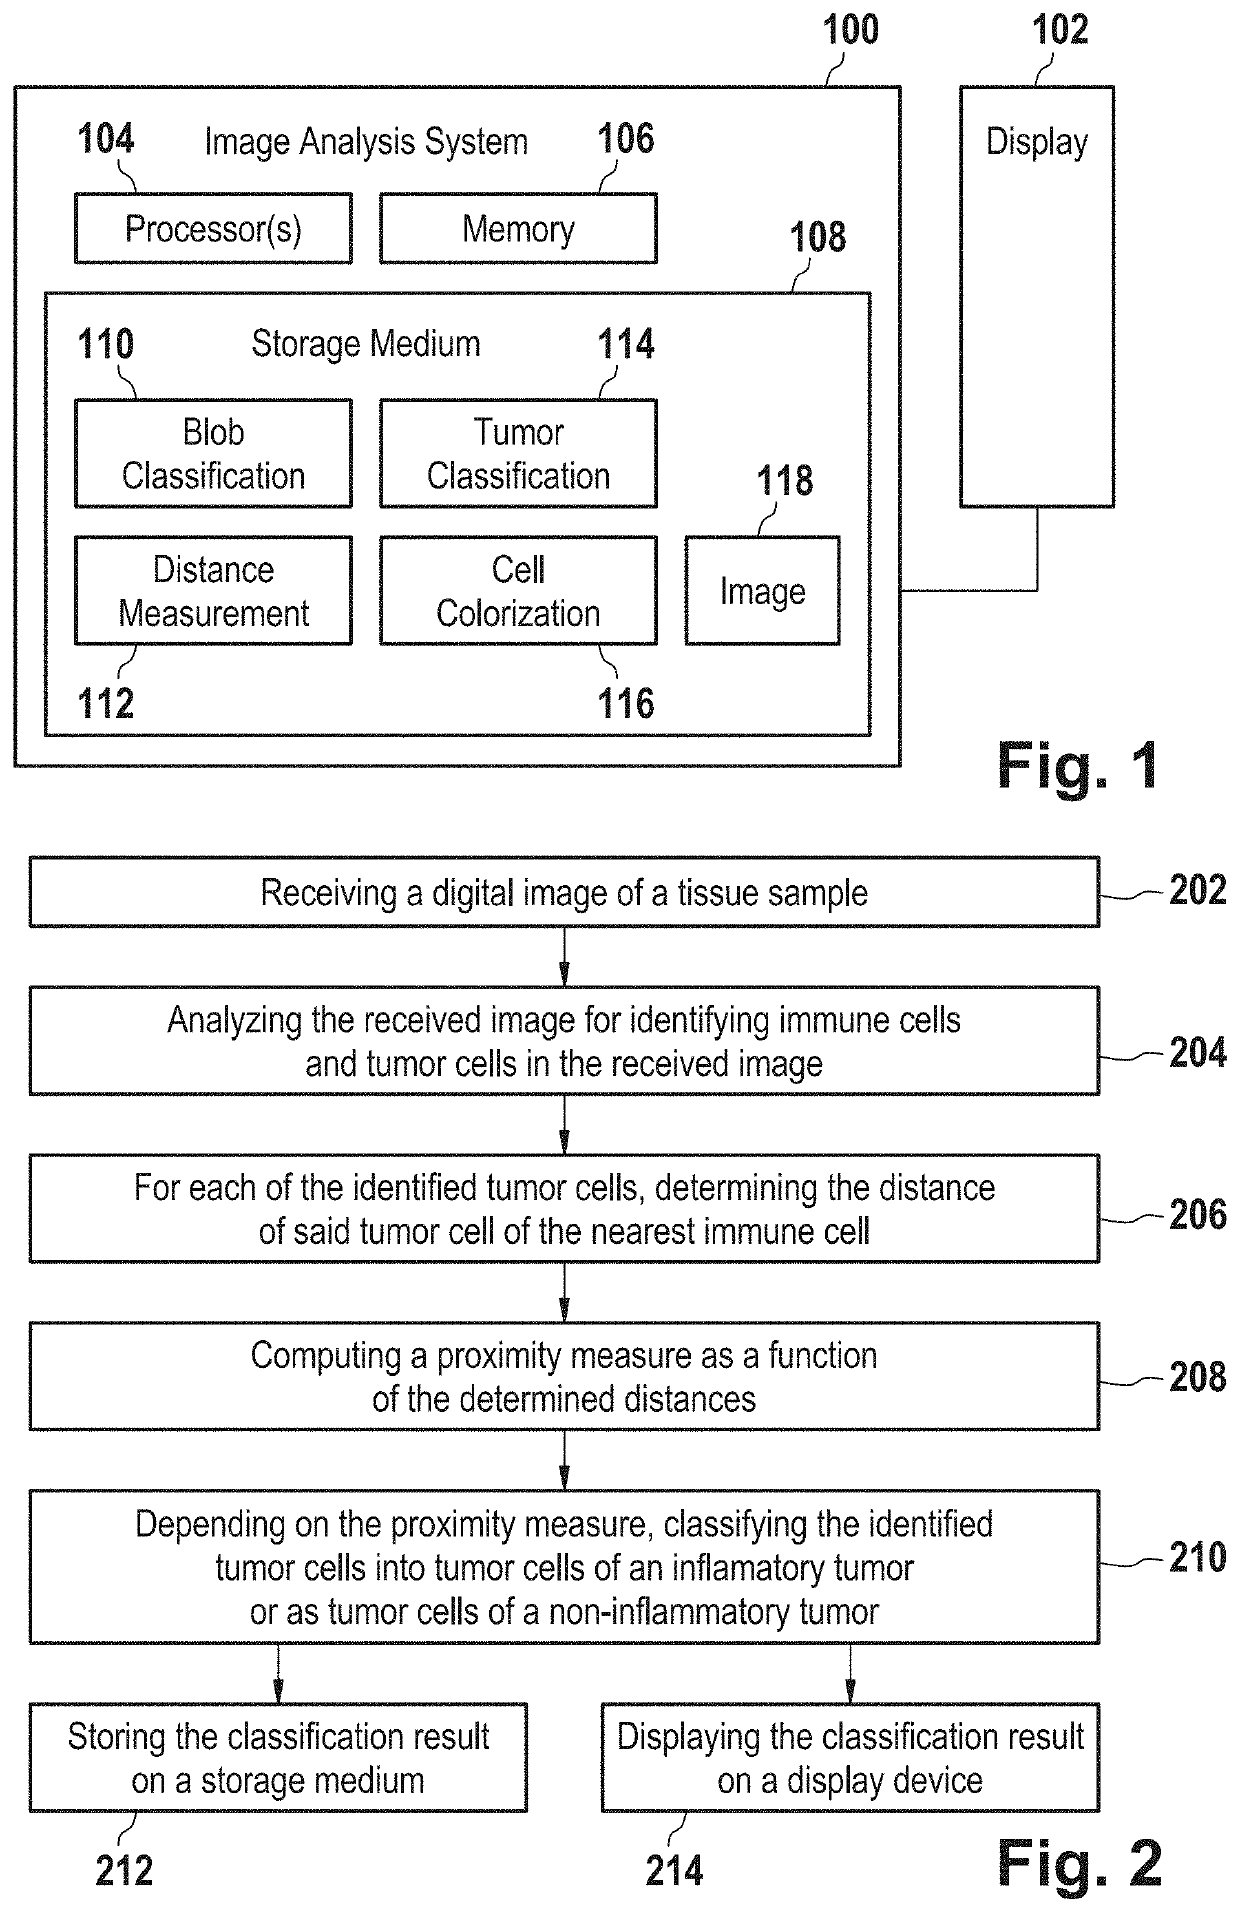
[0131]FIG. 1 is a block diagram of an image analysis system;

[0132]FIG. 2 is a flow chart of an image analysis method for classifying tumors;

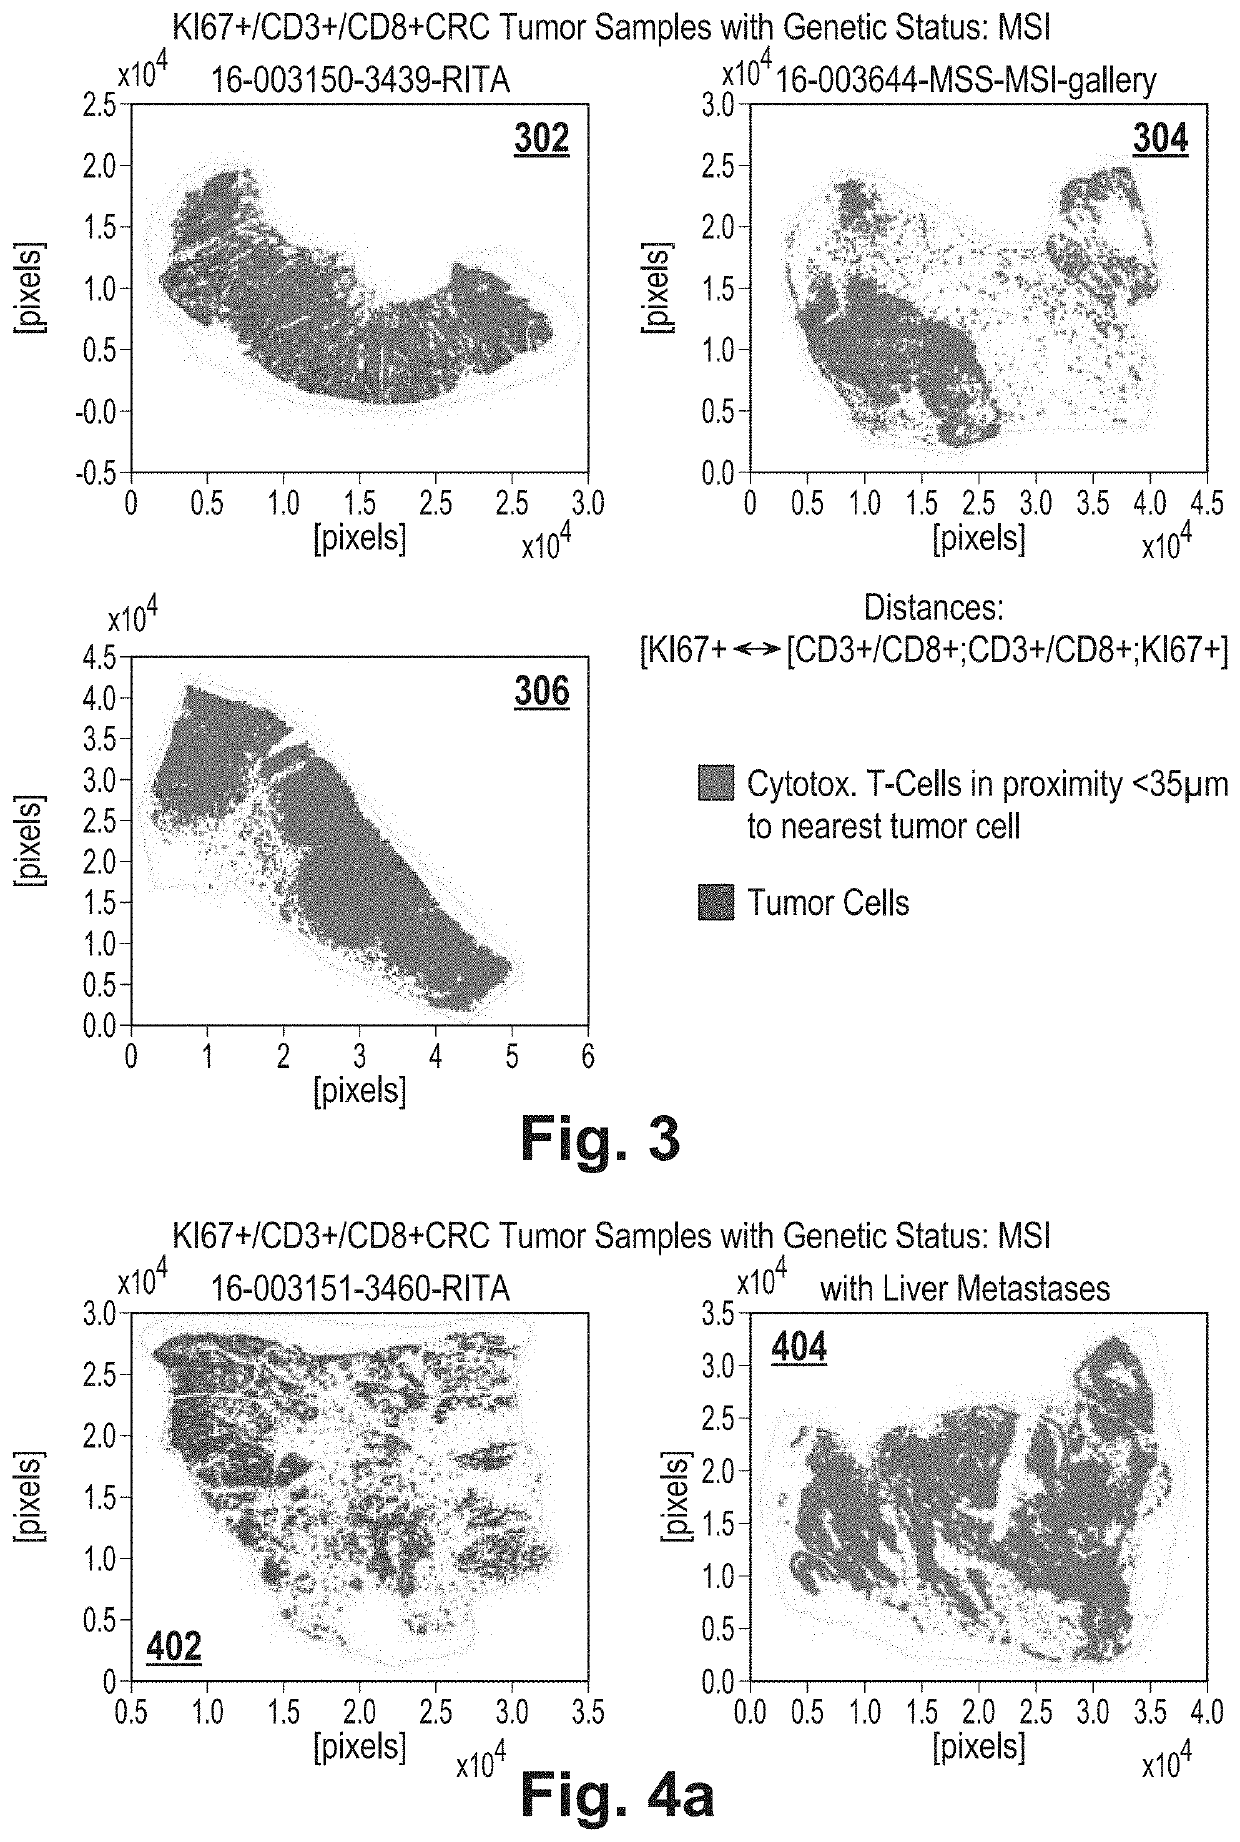
[0133]FIG. 3 depicts three overlay images derived from respective MSI tumor samples, the image comprising a first layer with tumor cells and a second layer with differently colored immune cells lying within a maximum distance from the nearest tumor cell;

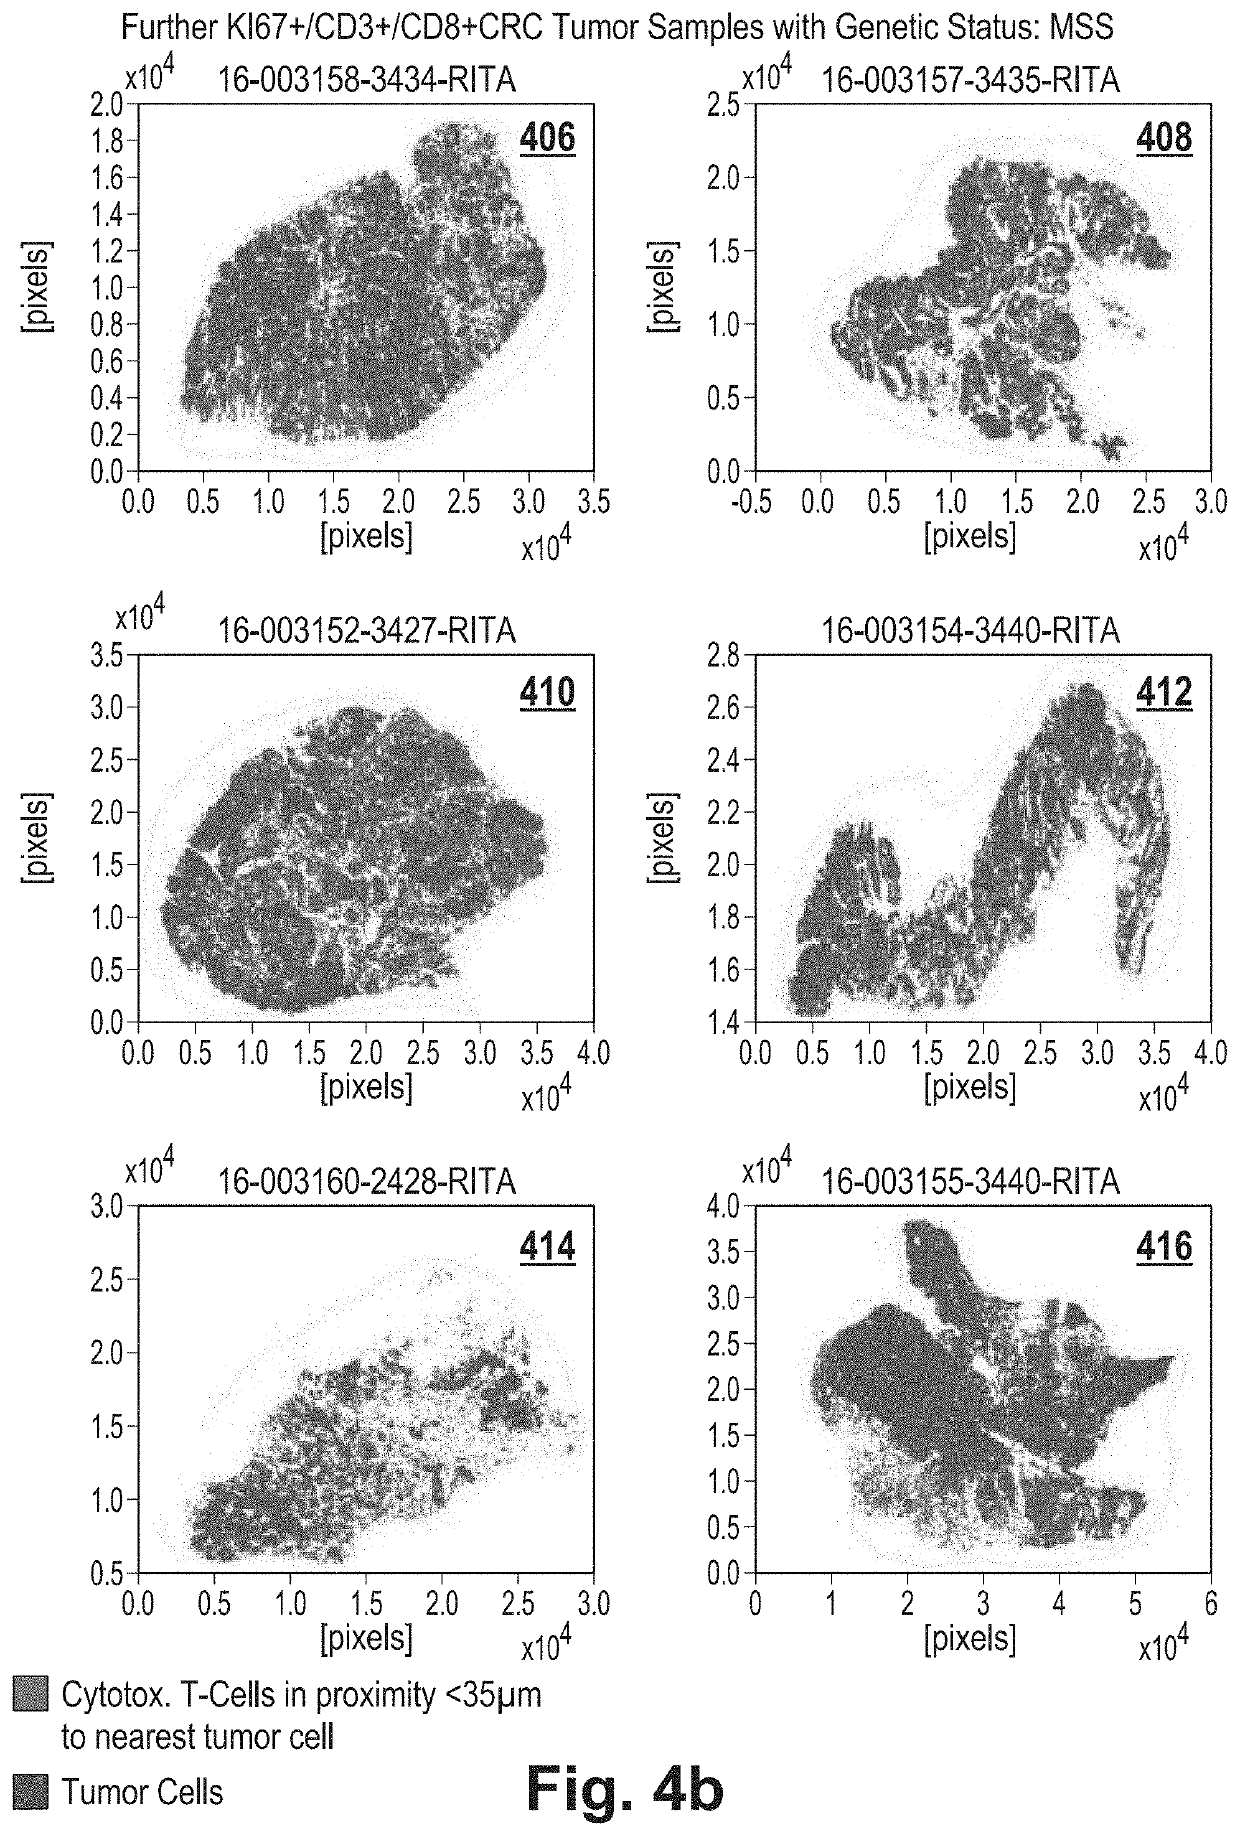
[0134]FIGS. 4a and 4b depict 8 overlay images derived from respective MSS tumor samples;

[0135]FIG. 5 depicts three histograms derived from the three MSI tissue samples depicted in FIG. 3;

[0136]FIGS. 6a and 6b depict 8 histograms derived from the 8 MSS tissue samples depicted in FIG. 4;

[0137]FIG. 7 depicts three IHC fluorescent images of the three MSI tissue samples depicted in FIG. 3;

[0138]FIGS. 8a and 8b depict 8 fluorescent images of the 8 MSS tissue samples depicted in FIG. 4;

[0139]FIG. 9 depicts a comparison of the overlay image, the IHC fluorescent image and the histogram generated for a MSI...


PUM


Abstract

At least one embodiment relates to an image analysis system for tumor classification. The system is configured for receiving at least one digital image of a tissue sample; analyzing the at least one received image for identifying immune cells and tumor cells in the at least one received image; for each of the identified tumor cells, determining the distance of the tumor cell to the nearest immune cell; computing a proximity measure as a function of the determined distances; in dependence on the proximity measure, classifying the identified tumor cells into tumor cells of an inflammatory tumor or as tumor cells of a non-inflammatory tumor; and storing the classification result on a storage medium and / or displaying the classification result on a display device.

Description

CROSS-REFERENCE TO RELATED APPLICATIONS[0001]This application is a national phase under 35 U.S.C. § 371 of PCT International Application No. PCT / EP2017 / 062037 which has an International filing date of May 18, 2017, which claims priority to European Application No. 16201272.8, filed Nov. 29, 2016, and European Application No. 16170224.6, filed May 18, 2016, the entire contents of each of which are hereby incorporated by reference.FIELD OF THE INVENTION[0002]The invention relates to the field of image analysis, and more particularly to the field of image-based tumor classification.BACKGROUND AND RELATED ART[0003]Microsatellite instability (MSI) is the condition of genetic hypermutability that results from impaired DNA mismatch repair (MMR). The presence of MSI represents phenotypic evidence that MMR is not functioning normally and thus is an indicator of the genetic state of a cell considered as a potential tumor cell.[0004]Microsatellite instability is known to be associated with col...

Claims


Application Information

Patent Timeline
Patent Type & Authority Patents(United States)
IPC IPC(8): G06T7/00G16H30/40A61B5/107
CPCG06T7/0012G16H30/40A61B5/1075G06T2207/30096G06T2207/10016G06T2207/20076
Inventor GAIRE, FABIENKLAIMAN, ELDADKORSKI, KONSTANTY
Owner F HOFFMANN LA ROCHE & CO AG
Why Eureka
Try Eureka